Exam 8: Prediction
Exam 1: Introduction25 Questions
Exam 2: Frequency Distributions, Percentiles,34 Questions
Exam 3: Graphic Representation of Frequency Distributions25 Questions
Exam 4: Central Tendency25 Questions
Exam 5: Variability and Standard Z Scores37 Questions
Exam 6: Standard Scores and the Normal Curve27 Questions
Exam 7: Correlation38 Questions
Exam 8: Prediction40 Questions
Exam 9: Interpretive Aspects of Correlation and Regression23 Questions
Exam 10: Probability29 Questions
Exam 11: Random Sampling and Sampling Distributions24 Questions
Exam 12: Introduction to Statistical Inference: Testing Hypotheses About Single Means Z and T74 Questions
Exam 13: Interpreting the Results of Hypothesis Testing: Effect Size, Type I and Type II Errors, and Power42 Questions
Exam 14: Testing Hypotheses About the Difference Between Two Independent Groups33 Questions
Exam 15: Testing for a Difference18 Questions
Exam 16: Inference About Correlation Coefficients24 Questions
Exam 17: An Alternative to Hypothesis Testing: Confidence Intervals28 Questions
Exam 18: Testing for Differences Among Three or More Groups: One-Way Analysis of Variance and Some Alternatives49 Questions
Exam 19: Factorial Analysis of Variance30 Questions
Exam 20: Chi-Square and Inference About Frequencies27 Questions
Exam 21: Some Almost Assumption-Free Tests19 Questions
Select questions type
If prediction is made from the Pearsonian regression line and linearity of regression does not hold, the predicted value of Y will be
(Multiple Choice)
5.0/5  (37)
(37)
The regression line for predicting Y from X is drawn so that which of the following is minimized?
(Multiple Choice)
4.8/5 (36)
The least squares line of regression for predicting Y from X minimizes
(Multiple Choice)
5.0/5 (34)
The following data are for freshman students at Spartan University: 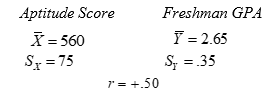 (a) Write the raw score regression equation for predicting Y from X and simplify it.
(b) John and Will score 485 and 710, respectively, on the aptitude test. Predict the freshman GPA for each.
(c) Compute the standard error of prediction.
(d) Set up the 95% confidence limits around John's and Will's predicted GPAs.
(e) For students with aptitude scores the same as John's, what proportion would be expected to obtain a GPA better than the freshman mean? What proportion would be expected to obtain a GPA of 2.0 or below?
(f) For students with aptitude scores the same as Will's, what proportion would be expected to obtain a GPA of 2.5 or better?
(a) Write the raw score regression equation for predicting Y from X and simplify it.
(b) John and Will score 485 and 710, respectively, on the aptitude test. Predict the freshman GPA for each.
(c) Compute the standard error of prediction.
(d) Set up the 95% confidence limits around John's and Will's predicted GPAs.
(e) For students with aptitude scores the same as John's, what proportion would be expected to obtain a GPA better than the freshman mean? What proportion would be expected to obtain a GPA of 2.0 or below?
(f) For students with aptitude scores the same as Will's, what proportion would be expected to obtain a GPA of 2.5 or better?
(Short Answer)
4.7/5 (36)
Estimates of predictive error utilizing the regression equation and the standard error of estimate are affected by random sampling variation. When this factor is taken into account, it is found that error estimates made by the methods of this chapter are generally
(Multiple Choice)
4.9/5 (37)
Which term, if any, does not appear in the raw score regression equation?
(Multiple Choice)
4.8/5 (39)
In predicting Y from a particular value of X, we report 68% of obtained values of Y to fall within
(Multiple Choice)
4.7/5 (37)
The manager of an ice cream company wants a better basis for deciding how much ice cream to make each evening. He would like to be able to predict the amount of ice cream sold at his retail outlets on any day from the temperature forecast the evening before. He records both the evening temperature forecast (X) and the number of five-gallon containers of ice cream sold the next day (Y) over a considerable period in the late spring and early summer. The following results are obtained:
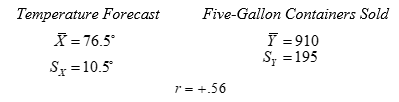 (a) Write the regression equation for predicting Y from X; simplify; and compute the standard error of prediction.
(b)Suppose the temperature forecast is for 96°. On what proportion of following days would he expect to sell over 1300 containers of ice cream?
(c)Suppose the forecast is for 50° and he plans to make 800 containers. For what proportion of the following days would this be too much ice cream?
(d)The regression equation is based on data gathered in the late spring and early summer. Will it "work" in midsummer, or in early fall?
(a) Write the regression equation for predicting Y from X; simplify; and compute the standard error of prediction.
(b)Suppose the temperature forecast is for 96°. On what proportion of following days would he expect to sell over 1300 containers of ice cream?
(c)Suppose the forecast is for 50° and he plans to make 800 containers. For what proportion of the following days would this be too much ice cream?
(d)The regression equation is based on data gathered in the late spring and early summer. Will it "work" in midsummer, or in early fall?
(Short Answer)
4.8/5 (36)
Consider the situation described from above. (a) Convert to z scores the heights of the following 10-year-olds: Benny (42.5 in.), Cal (55.3 in.), Arthur (50.1 in.), (b) Use the standard score form of the regression equation to obtain their predicted z scores for height as adults. (c) Convert the predicted z scores from (b) to predicted heights in inches and compare with the results Benny: 61.8, Cal: 73.9, Arthur: 69.0.
(Short Answer)
4.8/5 (30)
For what value of r does a particular z score in X lead us to predict the same z score in Y?
(Multiple Choice)
4.8/5 (39)
In a problem where we are predicting Y from X, which of the following can be considered a mean?
(Multiple Choice)
4.8/5 (37)
Filters
- Essay(0)
- Multiple Choice(0)
- Short Answer(0)
- True False(0)
- Matching(0)