Exam 10: Aggregate Demand and Aggregate Supply Analysis
Exam 1: Economics: Foundations and Models160 Questions
Exam 2: Choices and Trade Offs in the Market192 Questions
Exam 3: Where Prices Come From: the Interaction of Demand and Supply201 Questions
Exam 4: Gdp: Measuring Total Production, Income and Economic Growth123 Questions
Exam 5: Economic Growth, the Financial System and Business Cycles132 Questions
Exam 6: Long-Run Economic Growth: Sources and Policies118 Questions
Exam 7: Unemployment120 Questions
Exam 8: Inflation110 Questions
Exam 9: Aggregate Expenditure and Output in the Short Run138 Questions
Exam 10: Aggregate Demand and Aggregate Supply Analysis134 Questions
Exam 11: Money, Banks and the Reserve Bank of Australia123 Questions
Exam 12: Monetary Policy116 Questions
Exam 13: Fiscal Policy163 Questions
Exam 14: Macroeconomics in an Open Economy141 Questions
Exam 15: The International Financial System145 Questions
Select questions type
During an economic expansion or boom, it is possible for a short-run equilibrium to occur at a point that exceeds potential GDP.
Free
(True/False)
4.8/5  (23)
(23)
Correct Answer: Verified
True
The long-run adjustment to a supply shock results in:
Free
(Multiple Choice)
4.7/5 (45)
Correct Answer:Verified
A
Explain how the aggregate demand and supply model can be made more dynamic.
_____________________________________________________________________________________________
_____________________________________________________________________________________________
Free
(Essay)
4.8/5 (32)
Correct Answer:Verified
We can make the aggregate demand and supply model dynamic rather than static by making three changes to the basic model. First, potential GDP increases continually because the long-run aggregate supply curve normally continually shifts to the right. This is because workers are continually entering the labour force, technological change occurs, and the economy accumulates machinery and equipment. Secondly, aggregate demand shifts to the right during most years. This is because population and income increases over time. Finally, the short-run aggregate supply curve shifts to the right, except for periods of time when workers and firms expect high rates of inflation.
Which of the following would not be considered a positive addition to household wealth?
(Multiple Choice)
4.8/5 (26)
Refer to Figure 10.1 for the following questions.
Figure 10.1
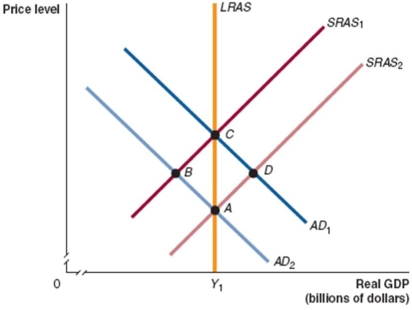 -Suppose the economy is at point A in Figure 10.1. If consumer spending increases in the economy, where will the eventual long-run equilibrium be?
(Multiple Choice)
4.9/5 (29)
The aggregate demand curve shows the relationship between the ________ and ________.
(Multiple Choice)
4.7/5 (37)
Spending on the national defence force is categorised as government purchases. How do increases in spending on defence affect the aggregate demand curve?
(Multiple Choice)
4.8/5 (28)
The level of long-run aggregate supply is not affected by changes in:
(Multiple Choice)
4.9/5 (36)
An increase in aggregate demand causes an increase in ________ only in the short run, but causes an increase in ________ in both the short run and the long run.
(Multiple Choice)
4.7/5 (37)
The Australian federal government lowered personal income taxes numerous times throughout the 2000s. Explain how this policy affected the aggregate demand curve.
_____________________________________________________________________________________________
_____________________________________________________________________________________________
(Essay)
4.8/5 (36)
The impact of a natural disaster on consumers in the economy can make them very pessimistic about their future incomes. How would an increase in pessimism affect the aggregate demand curve?
(Multiple Choice)
4.9/5 (27)
Which of the following is not an assumption made by the dynamic model of aggregate demand and aggregate supply?
(Multiple Choice)
4.9/5 (37)
An increase in disposable income will shift the aggregate demand curve to the right.
(True/False)
4.8/5 (30)
An increase in the quantity of capital in the economy shifts both the short-run and long-run aggregate supply curves.
(True/False)
4.8/5 (34)
Friedman argued that the government and central bank should use expansionary and contractionary policies to reduce fluctuations in real GDP.
(True/False)
4.9/5 (23)
Refer to Figure 10.2 for the following questions.
Figure 10.2
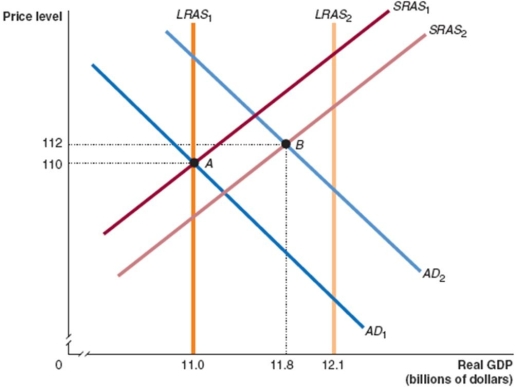 -In Figure 10.2, given the economy is at point A in year 1 and point B in year 2, what will happen to the unemployment rate in year 2?
(Multiple Choice)
4.7/5 (32)
Filters
- Essay(0)
- Multiple Choice(0)
- Short Answer(0)
- True False(0)
- Matching(0)