Exam 15: Income Inequality and Poverty
Exam 1: The Economic Approach210 Questions
Exam 2: A: Some Tools of the Economist224 Questions
Exam 2: B: Some Tools of the Economist33 Questions
Exam 3: A: Supply, Demand, and the Market Process225 Questions
Exam 3: B: Supply, Demand, and the Market Process180 Questions
Exam 4: A: Supply and Demand: Applications and Extensions233 Questions
Exam 4: B: Supply and Demand: Applications and Extensions98 Questions
Exam 5: Difficult Cases for the Market and the Role of Government168 Questions
Exam 6: The Economics of Collective Decision-Making180 Questions
Exam 7: Consumer Choice and Elasticity223 Questions
Exam 8: A: Costs and the Supply of Goods223 Questions
Exam 8: B: Costs and the Supply of Goods8 Questions
Exam 9: A: Price Takers and the Competitive Process237 Questions
Exam 9: B: Price Takers and the Competitive Process23 Questions
Exam 10: Price-Searcher Markets With Low Entry Barriers216 Questions
Exam 11: A: Price-Searcher Markets With High Entry Barriers229 Questions
Exam 11: B: Price-Searcher Markets With High Entry Barriers25 Questions
Exam 12: The Supply of and Demand for Productive Resources200 Questions
Exam 13: Earnings, Productivity, and the Job Market109 Questions
Exam 14: Investment, the Capital Market, and the Wealth of Nations129 Questions
Exam 15: Income Inequality and Poverty136 Questions
Exam 16: Appendix: Government Spending and Taxation79 Questions
Exam 17: Appendix: the Economics of Social Security54 Questions
Exam 18: Appendix: the Stock Market: Its Function, Performance, and Potential As an Investment Opportunity70 Questions
Exam 19: Appendix: Great Debates in Economics: Keynes Versus Hayek8 Questions
Exam 20: Appendix: the Crisis of 2008: Causes and Lessons for the Future64 Questions
Exam 21: Appendix: Lessons From the Great Depression60 Questions
Exam 22: Appendix: the Economics of Healthcare68 Questions
Exam 23: Appendix:education: Problems and Performance60 Questions
Exam 24: Appendix: Earnings Differences Between Men and Women47 Questions
Exam 26: Appendix: the Question of Resource Exhaustion61 Questions
Exam 25: Appendix: Do Labor Unions Increase the Wages of Workers74 Questions
Exam 27: Appendix: Difficult Environmental Cases and the Role of Government63 Questions
Select questions type
Figure 15-4
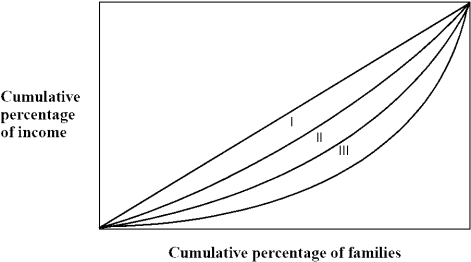 -Figure 15-4 shows the Lorenz Curve for three countries, I, II, and III. Of the three countries shown,
Free
(Multiple Choice)
4.8/5  (30)
(30)
Correct Answer: Verified
A
Why does the government provide benefits in-kind? Why don't we just give money to low-income people?
Free
(Essay)
4.9/5 (32)
Correct Answer:Verified
Benefits in-kind address the paternal aspects of government. The government's general policy is to provide food, shelter, health care, etc. to low-income people and not money, so people can purchase these items themselves. There is a suspicion that these individuals would not use the money to purchase items that they should value and instead would buy items they should value less.
Figure 15-2
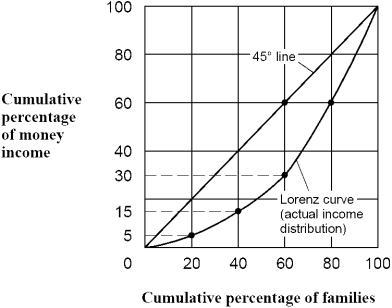 -According to the Lorenz curve shown in Figure 15-2, what percentage of total income is earned by the richest 20 percent of families?
Free
(Multiple Choice)
4.9/5 (35)
Correct Answer:Verified
B
Which of the following is true concerning the distribution of income?
(Multiple Choice)
4.9/5 (37)
(I) In 2009, a family of four making $22,050 would be considered living in poverty. (II) The poverty threshold level of income is adjusted for family size and for inflation (price level changes) through time.
(Multiple Choice)
4.9/5 (31)
It would be more reasonable to use annual income data as an index of economic inequality if all of the households
(Multiple Choice)
4.9/5 (41)
If a family earned $10,000 and, as a consequence, sustained a reduction of $4,000 in government benefits, the family's implicit marginal tax rate would be
(Multiple Choice)
4.8/5 (30)
This year, Bob earned a total of $9,000. As a result, he received $9,000 less in government transfers. Therefore, his implicit marginal tax rate is
(Multiple Choice)
4.8/5 (33)
Which of the following is false about data on the inequality of annual family (or household) incomes?
(Multiple Choice)
4.8/5 (29)
Compared to those with lower incomes, families with higher incomes are more likely to be headed by a
(Multiple Choice)
4.7/5 (42)
In a market economy, individuals have a strong incentive to develop their skills and provide others with resources, goods, and services that they value because these activities generally
(Multiple Choice)
4.7/5 (42)
When there is only a weak link between work effort and reward
(Multiple Choice)
4.9/5 (40)
The idea that transfer benefits to the poor encourage behavior that increases the risk of poverty is known as the
(Multiple Choice)
4.7/5 (35)
Assume that Peter is a single parent who is in poverty. He receives food stamps and Medicaid. For every $100 that he earns, Peter loses $35 of his food stamp benefits and $20 in his Medicaid benefits. Also, Peter's income is taxed at a rate of 10 percent. Then, Peter's effective marginal tax rate is
(Multiple Choice)
4.8/5 (36)
Filters
- Essay(0)
- Multiple Choice(0)
- Short Answer(0)
- True False(0)
- Matching(0)