Exam 22: An Introduction to Macroeconomics
Exam 1: What Is Economics232 Questions
Exam 2: The Economy: Myth and Reality155 Questions
Exam 3: The Fundamental Economic Problem: Scarcity and Choice255 Questions
Exam 4: Supply and Demand: an Initial Look313 Questions
Exam 5: Consumer Choice: Individual and Market Demand206 Questions
Exam 6: Demand and Elasticity214 Questions
Exam 7: Production, Inputs, and Cost: Building Blocks for Supply Analysis221 Questions
Exam 8: Output, Price, and Profit: the Importance of Marginal Analysis194 Questions
Exam 9: Securities: Business Finance and the Economy: the Tail That Wags the Dog203 Questions
Exam 10: The Firm and the Industry Under Perfect Competition212 Questions
Exam 11: Monopoly208 Questions
Exam 12: Between Competition and Monopoly230 Questions
Exam 13: Limiting Market Power: Regulation and Antitrust155 Questions
Exam 14: The Case for Free Markets: the Price System225 Questions
Exam 15: The Shortcomings of Free Markets219 Questions
Exam 16: Externalities, the Environment, and Natural Resources222 Questions
Exam 17: Taxation and Resource Allocation221 Questions
Exam 18: Pricing the Factors of Production233 Questions
Exam 19: Labor and Entrepreneurship: the Human Inputs271 Questions
Exam 20: Poverty, Inequality, and Discrimination172 Questions
Exam 21: Is Useconomic Leadership Threatened75 Questions
Exam 22: An Introduction to Macroeconomics216 Questions
Exam 23: The Goals of Macroeconomic Policy212 Questions
Exam 24: Economic Growth: Theory and Policy228 Questions
Exam 25: Aggregate Demand and the Powerful Consumer219 Questions
Exam 26: Demand-Side Equilibrium: Unemployment or Inflation216 Questions
Exam 27: Bringing in the Supply Side: Unemployment and Inflation228 Questions
Exam 28: Managing Aggregate Demand: Fiscal Policy210 Questions
Exam 29: Money and the Banking System224 Questions
Exam 30: Monetary Policy: Conventional and Unconventional210 Questions
Exam 31: He Financial Crisis and the Great Recession66 Questions
Exam 32: The Debate Over Monetary and Fiscal Policy219 Questions
Exam 33: Budget Deficits in the Short and Long Run215 Questions
Exam 34: The Trade-Off Between Inflation and Unemployment219 Questions
Exam 35: International Trade and Comparative Advantage223 Questions
Exam 36: The International Monetary System: Order or Disorder218 Questions
Exam 37: Exchange Rates and the Macroeconomy219 Questions
Select questions type
GDP in 2015 would not include the resale of a house built in 2000.
Free
(True/False)
4.9/5  (32)
(32)
Correct Answer: Verified
True
Cars produced by General Motors in Mexico would be included in U.S.Gross Domestic Product.
Free
(True/False)
4.7/5 (36)
Correct Answer:Verified
False
A good produced in 2009 and held in inventory until it is sold in 2010 would be included in which measure of GDP?
(Multiple Choice)
4.9/5 (28)
What are intermediate goods?
Why do economists exclude the value of intermediate goods while calculating national income?
(Essay)
4.9/5 (35)
What makes the macroeconomic performance of the 1993 to 1998 period so unusual is the
(Multiple Choice)
4.9/5 (25)
The first year of the Bush administration in 2001 could be represented as a(n)
(Multiple Choice)
4.9/5 (35)
The horizontal axis on the aggregate demand-aggregate supply model measures
(Multiple Choice)
4.7/5 (26)
Economist John Maynard Keynes wrote that the economy naturally gravitates toward smooth growth and high levels of employment.
(True/False)
4.8/5 (32)
Before the Great Depression of the 1930s, most economists believed that
(Multiple Choice)
4.9/5 (45)
The existence of the "underground economy" causes measured GDP to overestimate actual output.
(True/False)
4.8/5 (33)
While their respective subject matters differ greatly, both microeconomists and macroeconomists rely on the same basic tools; that is, both rely on
(Multiple Choice)
4.8/5 (40)
Aggregate demand and supply curves have been widely used to analyze the performance of the macroeconomy.Figure 5-3 shows four diagrams that represent different changes in the macroeconomy.Choose the diagram that best represents the situations described in the following questions.??Figure 5-3
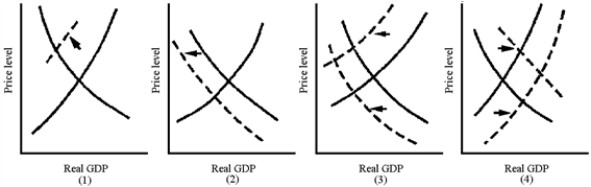 -Which graph in Figure 5-3 best represents the aggregate demand-induced Great Depression of the 1930s?
(Multiple Choice)
4.9/5 (37)
Stagflation is the simultaneous occurrence of inflation and high unemployment.
(True/False)
4.9/5 (41)
John Maynard Keynes wrote that economies can suffer recession or depression for many years if the government does not intervene.
(True/False)
4.8/5 (32)
Filters
- Essay(0)
- Multiple Choice(0)
- Short Answer(0)
- True False(0)
- Matching(0)