Exam 8: Statistical Functions
Exam 1: Introduction to Excel100 Questions
Exam 2: Formulas and Functions100 Questions
Exam 3: Charts100 Questions
Exam 4: Datasets and Tables100 Questions
Exam 5: Subtotals, Pivottables, and Pivotcharts100 Questions
Exam 6: What-If Analysis100 Questions
Exam 7: Specialized Functions100 Questions
Exam 8: Statistical Functions100 Questions
Exam 9: Multiple-Sheet Workbook Management98 Questions
Exam 10: Imports, Xml, and Power Add-Ins95 Questions
Exam 11: Collaboration and Workbook Distribution96 Questions
Exam 12: Templates, Styles, and Macros97 Questions
Exam 13: Appendix: Exploring Microsoft Office Excel 2016 Comprehensive Poatsygrauer115 Questions
Select questions type
________ is a measure of a dataset's dispersion or the difference between the highest and lowest values.
(Short Answer)
4.8/5  (38)
(38)
The ________ function returns the forecasted values for a specific future target date using exponential smoothing.
(Short Answer)
4.9/5 (39)
The ________ function returns the length of the repetitive pattern Excel detects for the time series.
(Short Answer)
4.8/5 (37)
In SUMIFS, AVERAGEIFS and COUNTIFS functions, you must have a(n)________ argument for each criteria_range argument.
(Short Answer)
4.7/5 (40)
The CORREL function would be useful to determine the strength of a relationship between two variables.
(True/False)
4.9/5 (39)
Match each of the following terms to its description:
Correct Answer: Verified
Premises:
Responses:
(Matching)
4.9/5 (40)
This is the top three lines in a list of 8200 records.You want an average of the number of speeding tickets for Red Toyota Priuses.Which is the correct formula? 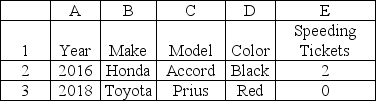
(Multiple Choice)
4.9/5 (32)
This formula will successfully count all green items in the range C2:C256.
=COUNTIF(C2:C256,green)
(True/False)
4.8/5 (32)
The ________ is an add-in program that provides statistical analysis tools.
(Short Answer)
4.8/5 (38)
Which function would you use to test for a relationship between students' attendance and their test scores?
(Multiple Choice)
4.7/5 (33)
This is the first 4 lines of an excel list of 3082 records. Which formula counts the number of Gold Level Members in the entire list?
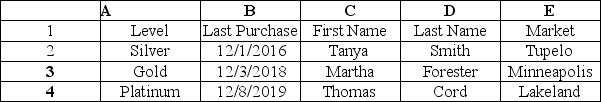
(Multiple Choice)
4.9/5 (44)
To determine how often a value occurs in a dataset, use the SUMIFS function.
(True/False)
4.8/5 (34)
What is the Criteria2 argument of: =COUNTIFS(A2:A64,"Blue",B2:B64,"Black")?
(Multiple Choice)
4.8/5 (42)
Match each of the following concepts to its most likely application:
Correct Answer:Verified
Premises:
Responses:
(Matching)
4.7/5 (29)
Filters
- Essay(0)
- Multiple Choice(0)
- Short Answer(0)
- True False(0)
- Matching(0)