Exam 17: New Classical Macro and New Keynesian Macro
Exam 1: What Is Macroeconomics71 Questions
Exam 2: The Measurement of Income,prices,and Unemployment104 Questions
Exam 3: Income and Interest Rates: the Keynesian Cross Model and the Is Curve167 Questions
Exam 4: Strong and Weak Policy Effects in the Is-Lm Model148 Questions
Exam 5: Financial Markets, financial Regulation, and Economic Instability52 Questions
Exam 6: The Government Budget, the Government Debt, and the Limitations of Fiscal Policy149 Questions
Exam 7: International Trade, exchange Rates, and Macroeconomic Policy156 Questions
Exam 8: Aggregate Demand, aggregate Supply, and the Great Depression155 Questions
Exam 9: Inflation: Its Causes and Cures191 Questions
Exam 10: The Goals of Stabilization Policy: Low Inflation and Low Unemployment132 Questions
Exam 11: The Theory of Economic Growth113 Questions
Exam 12: The Big Questions of Economic Growth74 Questions
Exam 13: Money,banks,and the Federal Reserve148 Questions
Exam 14: The Goals, tools, and Rules of Monetary Policy135 Questions
Exam 15: The Economics of Consumption Behavior103 Questions
Exam 16: The Economics of Investment Behavior111 Questions
Exam 17: New Classical Macro and New Keynesian Macro170 Questions
Exam 18: Conclusion: Where We Stand29 Questions
Select questions type
Figure 17-3
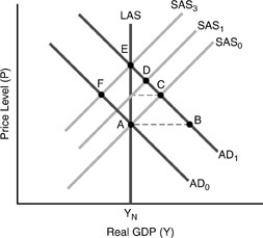 -In Figure 17-3 above,suppose we are working under assumptions of the Lucas model.With an expansionary monetary policy,the "policy ineffectiveness proposition" is shown as a movement between points
(Multiple Choice)
4.9/5  (35)
(35)
Suppose there is a 5 percent increase in nominal demand in every industry in an economy.Factors that keep the price level from also rising by 5 percent are called
(Multiple Choice)
4.9/5 (31)
In the RBC model,an adverse supply shock causes the decrease in natural real GDP to be minimized when the labor supply curve is
(Multiple Choice)
4.8/5 (31)
In the RBC model,an adverse supply shock causes the decrease in natural real GDP to be maximized when the labor supply curve is
(Multiple Choice)
4.8/5 (31)
With the assumption that some voluntary exchanges that would make both parties better off are somehow being blocked,we have the basis for a ________ macroeconomic model,such as those constructed by ________ economists.
(Multiple Choice)
4.9/5 (39)
Which of the following are NOT included among Gordon's criticisms of Friedman's fooling model?
(Multiple Choice)
4.9/5 (37)
Suppose a worker signs a contract containing an 8 percent nominal wage increase with inflation expected to be 3 percent.Inflation turns out to be 6 percent,but the contract also contains 60 percent COLA protection.The worker's real wage under the contract
(Multiple Choice)
4.8/5 (44)
In Figure 17-4,below,initial demand,marginal cost,and marginal revenue curves (none of them shown)caused the firm to produce the profit-maximizing quantity Y₀ at a price of P₀.Now the demand and marginal cost curves have moved to those shown,with the marginal revenue curve running through point L.
Figure 17-4
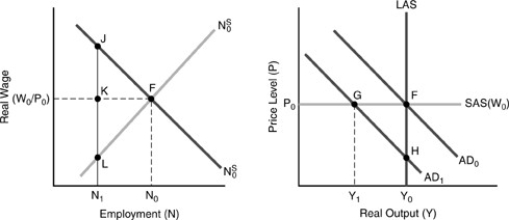 -If the firm in Figure 17-4 above maintains its set price of P₀,rather than dropping price to P₁,it must be facing a "menu cost" of adjusting its price that exceeds
(Multiple Choice)
4.8/5 (43)
After a shift from AD₀ to AD₁,which of the following patterns of adjustment is consistent with the "Price Fooling" model?
(Multiple Choice)
4.8/5 (22)
Because efficiency wage theory deals with the consequences of a change in a firm's ________ wage,if all wages were indexed to nominal aggregate demand the theory would be ________.
(Multiple Choice)
4.9/5 (25)
The more that firms in an economy believe that the demand for their goods is mainly influenced by "local conditions" and not the aggregate level of demand,the ________ is the SAS curve and thus the ________ are cycles in real GDP.
(Multiple Choice)
4.9/5 (39)
Robert Lucas Jr.adapted the fooling model to his own way of thinking by replacing that model's assumption of
(Multiple Choice)
4.9/5 (26)
After a drop in nominal aggregate demand,if menu costs prevent firms from reducing prices,this is considered ________ act by firms ________ a "macroeconomic externality."
(Multiple Choice)
4.9/5 (33)
In the fooling model,suppose that from an initial AD/SAS/LAS equilibrium a sudden expansion of aggregate demand occurs.With fooling,we would find employment and the actual real wage in the labor market diagram by moving
(Multiple Choice)
4.7/5 (37)
If the markets in the economy are characterized by rational expectations,then
(Multiple Choice)
4.7/5 (33)
In the fooling model's labor market diagram,from an initial intersection point of the labor supply and demand curves,tracing "northwest" up the labor demand curve shows
(Multiple Choice)
4.8/5 (39)
Filters
- Essay(0)
- Multiple Choice(0)
- Short Answer(0)
- True False(0)
- Matching(0)