Exam 11: Aggregate Supply and Aggregate Demand
Exam 1: Getting Started272 Questions
Exam 2: The Australian and Global Economies171 Questions
Exam 3: The Economic Problem218 Questions
Exam 4: Demand and Supply144 Questions
Exam 5: Gdp: a Measure of Total Production and Income135 Questions
Exam 6: Jobs and Unemployment133 Questions
Exam 7: The Cpi and the Cost of Living131 Questions
Exam 8: Economic Growth138 Questions
Exam 9: Finance,saving and Investment157 Questions
Exam 10: Money,the Price Level and Inflation213 Questions
Exam 11: Aggregate Supply and Aggregate Demand176 Questions
Exam 12: Aggregate Expenditure Multiplier189 Questions
Exam 13: The Short-Run Policy Trade Off134 Questions
Exam 14: Fiscal Policy148 Questions
Exam 15: Monetary Policy108 Questions
Exam 16: International Trade Policy122 Questions
Exam 17: International Finance145 Questions
Select questions type
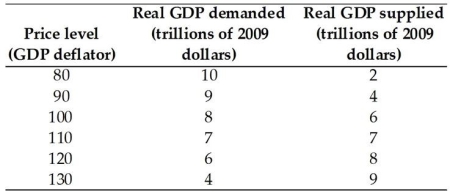 The table gives the aggregate demand and aggregate supply schedules for a nation.
-Refer to the table above.If the price level is 120,then the aggregate quantity demanded is ________ than the aggregate quantity supplied and the price level ________.
The table gives the aggregate demand and aggregate supply schedules for a nation.
-Refer to the table above.If the price level is 120,then the aggregate quantity demanded is ________ than the aggregate quantity supplied and the price level ________.
(Multiple Choice)
4.7/5  (35)
(35)
Suppose the exchange rate in the year 2014 was 5 yuan per dollar and in 2015 the exchange rate fell to 4 yuan per dollar.If the price of a Chinese jumper was 120 yuan in both years,the new dollar price in 2015 would be ________ and imports of Chinese jumpers would ________.
(Multiple Choice)
4.8/5 (36)
A crisis in the Middle East drastically raises the price of petroleum.If the aggregate demand curve does NOT shift,then aggregate supply will ________,real GDP will ________,and the price level will ________.
(Multiple Choice)
4.8/5 (24)
If the price of widgets is $2 and the real wage is $20 per hour then the firm must sell 10 widgets to cover the cost of an hour of labour.If the price of widgets rises to $4,how many widgets must the firms sell to cover the cost of an hour of labour?
(Multiple Choice)
4.8/5 (41)
If there is a rise in the price level,there is a(n)________ movement along the AS curve because there is ________ in the quantity of real GDP supplied.
(Multiple Choice)
4.8/5 (24)
If the aggregate demand curve and the aggregate supply curve intersect at a level of real GDP greater than potential GDP,there is
(Multiple Choice)
4.9/5 (41)
A recessionary gap occurs when ________ so that real GDP is ________ potential GDP.
(Multiple Choice)
4.7/5 (33)
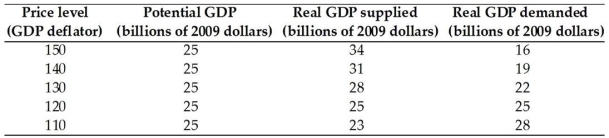 -The table above gives data for the nation of Pearl,a small island in the South Pacific.If a supply shock decreases the quantity of real GDP supplied by $6 billion at each price level,the new equilibrium real GDP is
(Multiple Choice)
5.0/5 (36)
At the beginning of 2017,a country is at full-employment.During 2017,oil-producing countries decrease oil production leading to much higher oil prices.The higher oil prices can
(Multiple Choice)
4.8/5 (36)
-The table above gives data for the nation of Pearl,a small island in the South Pacific.The economy is at full employment when real GDP is
(Multiple Choice)
4.8/5 (28)
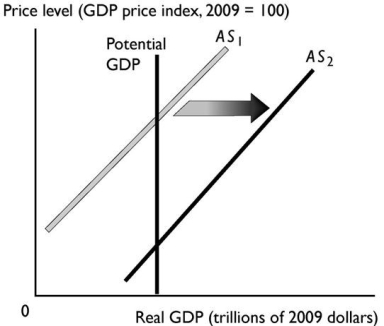 The change reflected in the above figure might be a result of
(Multiple Choice)
4.9/5 (38)
Which of the following shifts the aggregate supply curve rightward?
(Multiple Choice)
4.8/5 (34)
Which of the following shifts the aggregate supply curve leftward?
(Multiple Choice)
4.8/5 (39)
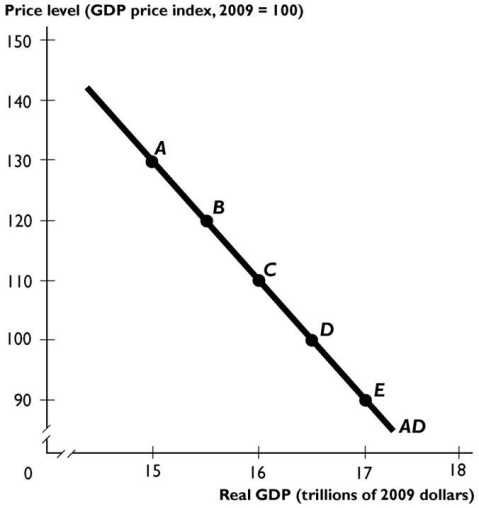 -The aggregate demand curve in the figure above shifts rightward if
(Multiple Choice)
4.9/5 (33)
If oil prices increase then,in the short run,real GDP will ________ and the price level will ________.
(Multiple Choice)
4.8/5 (26)
Which of the following shifts the aggregate demand curve rightward?
(Multiple Choice)
4.8/5 (43)
When the price level rises and increases the demand for money,the nominal interest rate ________ and the real interest rate ________.
(Multiple Choice)
4.9/5 (36)
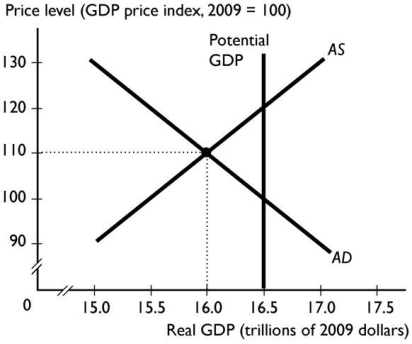 -In the figure above,the economy is at an equilibrium with real GDP of $16 trillion and a price level of 110.As the economy moves toward its ultimate equilibrium,the ________ curve shifts ________.
(Multiple Choice)
4.8/5 (42)
Filters
- Essay(0)
- Multiple Choice(0)
- Short Answer(0)
- True False(0)
- Matching(0)