Multiple Choice
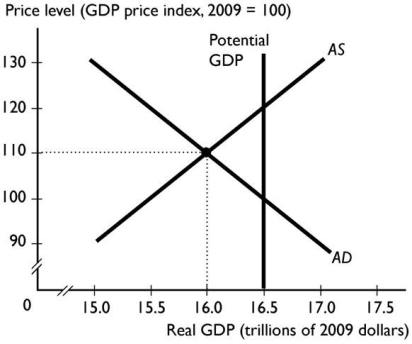
-In the figure above,the economy is at an equilibrium with real GDP of $16 trillion and a price level of 110.As the economy moves toward its ultimate equilibrium,the ________ curve shifts ________.
A) potential GDP;leftward
B) aggregate supply;rightward
C) aggregate demand;leftward
D) aggregate demand;rightward
E) aggregate supply;leftward
Correct Answer:

Verified
Correct Answer:
Verified
Q19: <img src="https://d2lvgg3v3hfg70.cloudfront.net/TB8401/.jpg" alt=" -The aggregate demand
Q20: When the price level rises and increases
Q22: Which of the following shifts the aggregate
Q28: If profits are high because the price
Q42: Which of the following shifts the aggregate
Q64: The aggregate supply curve is a(n) _
Q76: If oil prices increase then,in the short
Q76: An increase in _ increases potential GDP
Q83: Changes in which of the following do
Q83: <img src="https://d2lvgg3v3hfg70.cloudfront.net/TB1012/.jpg" alt=" The change in