Exam 10: Applying Population Ecology: the Human Population
Exam 1: Environmental Problems: an Introduction and Overview85 Questions
Exam 2: Environmental History: Learning From the Past83 Questions
Exam 3: Science, systems, matter, and Energy126 Questions
Exam 4: Ecosystems: What Are They, and How Do They Work201 Questions
Exam 5: Evolution and Biodiversity80 Questions
Exam 6: Climate and Terrestrial Biodiversity156 Questions
Exam 7: Aquatic Biodiversity99 Questions
Exam 8: Community Ecology104 Questions
Exam 9: Population Ecology90 Questions
Exam 10: Applying Population Ecology: the Human Population119 Questions
Exam 11: Sustaining Terrestrial Biodiversity: Managing and Protecting Ecosystems93 Questions
Exam 12: Sustaining Biodiversity: the Species Approach106 Questions
Exam 13: Sustaining Aquatic Biodiversity77 Questions
Exam 14: Food and Soil Resources113 Questions
Exam 15: Water Resources86 Questions
Exam 16: Geology and Nonrenewable Mineral Resources91 Questions
Exam 17: Nonrenewable Energy Resources105 Questions
Exam 18: Energy Efficiency and Renewable Energy106 Questions
Exam 19: Risk,toxicology,and Human Health116 Questions
Exam 20: Air Pollution120 Questions
Exam 21: Climate Change and Ozone Loss99 Questions
Exam 22: Water Pollution110 Questions
Exam 23: Pest Management91 Questions
Exam 24: Solid and Hazardous Waste91 Questions
Exam 25: Sustainable Cities85 Questions
Exam 26: Economics, environment, and Sustainability71 Questions
Exam 27: Politics, environment, and Sustainability65 Questions
Exam 28: Environmental World-views, ethics, and Sustainability78 Questions
Select questions type
Family planning,economic opportunities for women,and schooling for girls generally result in a higher birth rate.
Free
(True/False)
4.9/5  (35)
(35)
Correct Answer: Verified
False
What was NOT included as one of the goals that emerged from the UN's 1994 International Conference on Population and Development?
Free
(Multiple Choice)
4.9/5 (43)
Correct Answer:Verified
C
WORLD POPULATION GRAPH
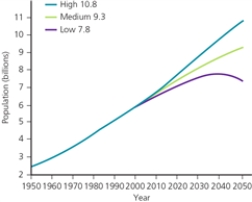 -According to the graph,what is the highest projected world population for the year 2040?
Free
(Short Answer)
4.9/5 (35)
Correct Answer:Verified
About 9.5 billion
AVERAGE CRUDE BIRTH AND DEATH RATES FOR VARIOUS COUNTRIES IN 2013
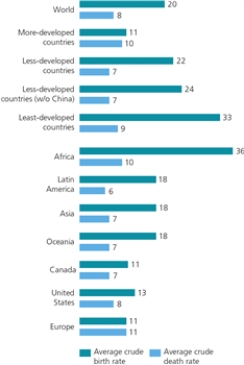 -According to the graph,what are Canada's approximate crude birth and crude death rates?
(Short Answer)
5.0/5 (32)
Which country would experience the greatest rise in total population size in one year?
(Multiple Choice)
4.9/5 (34)
Which statement would be made by a person who supports population regulation?
(Multiple Choice)
4.7/5 (32)
Populations need to be large in order to gain better services,therefore poor countries with large populations need development aid rather than population-reduction programs.
(True/False)
4.7/5 (34)
Birth and death rates generally decline as a country develops economically.
(True/False)
4.8/5 (34)
BAR GRAPH OF DEMOGRAPHIC DATA FOR CANADA, THE U.S., AND MEXICO
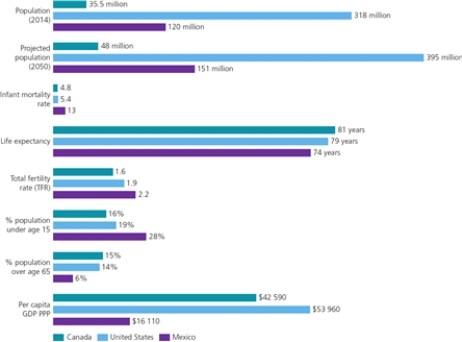 -According to the graph,which country has the fewest old people?
(Short Answer)
4.7/5 (34)
BAR GRAPH OF DEMOGRAPHIC DATA FOR INDIA AND CHINA
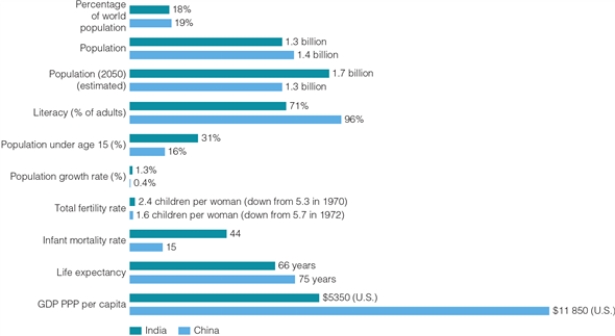 -According to the graph,is it true that China's fairly low rate of population growth is related to having a lower total fertility rate and a lower life expectancy than India has?
(Essay)
4.9/5 (37)
The total fertility rate is the average number of children a typical woman bears during her reproductive years.
(True/False)
4.9/5 (39)
The most effective form of birth control is ______________________________.
(Short Answer)
4.8/5 (31)
Which statement describes the family planning program of India?
(Multiple Choice)
4.8/5 (37)
Which stage will have high birth rates,according to the demographic transition model?
(Multiple Choice)
4.8/5 (39)
Filters
- Essay(0)
- Multiple Choice(0)
- Short Answer(0)
- True False(0)
- Matching(0)