Exam 10: Dynamic Change, Economic Fluctuations, and the Ad-As Model
Exam 1: The Economic Approach210 Questions
Exam 2: A : Some Tools of the Economist224 Questions
Exam 2: B : Some Tools of the Economist33 Questions
Exam 3: A : Supply, Demand, and the Market Process225 Questions
Exam 3: B : Supply, Demand, and the Market Process180 Questions
Exam 4: A : Supply and Demand: Applications and Extensions233 Questions
Exam 4: B : Supply and Demand: Applications and Extensions98 Questions
Exam 5: Difficult Cases for the Market and the Role of Government168 Questions
Exam 6: The Economics of Collective Decision-Making180 Questions
Exam 7: A : Taking the Nations Economic Pulse238 Questions
Exam 7: B : Taking the Nations Economic Pulse50 Questions
Exam 8: Economic Fluctuations, Unemployment, and Inflation242 Questions
Exam 9: A : an Introduction to Basic Macroeconomic Markets237 Questions
Exam 9: B : an Introduction to Basic Macroeconomic Markets24 Questions
Exam 10: Dynamic Change, Economic Fluctuations, and the Ad-As Model224 Questions
Exam 11: Fiscal Policy: the Keynesian View and Historical Perspective139 Questions
Exam 12: Fiscal Policy, Incentives, and Secondary Effects171 Questions
Exam 13: A : Money and the Banking System250 Questions
Exam 13: B : Money and the Banking System10 Questions
Exam 14: Modern Macroeconomics and Monetary Policy220 Questions
Exam 15: Stabilization Policy, Output, and Employment177 Questions
Exam 16: Creating an Environment for Growth and Prosperity142 Questions
Exam 17: Institutions, Policies, and Cross-Country Differences in Income and Growth153 Questions
Exam 18: Gaining From International Trade222 Questions
Exam 19: International Finance and the Foreign Exchange Market162 Questions
Exam 20: Consumer Choice and Elasticity223 Questions
Exam 21: A : Costs and the Supply of Goods223 Questions
Exam 21: B : Costs and the Supply of Goods8 Questions
Exam 22: A : Price Takers and the Competitive Process237 Questions
Exam 22: B : Price Takers and the Competitive Process23 Questions
Exam 23: Price-Searcher Markets With Low Entry Barriers216 Questions
Exam 24: A : Price-Searcher Markets With High Entry Barriers229 Questions
Exam 24: B : Price-Searcher Markets With High Entry Barriers25 Questions
Exam 25: The Supply of and Demand for Productive Resources200 Questions
Exam 26: Earnings, Productivity, and the Job Market109 Questions
Exam 27: Investment, the Capital Market, and the Wealth of Nations129 Questions
Exam 28: Income Inequality and Poverty136 Questions
Special Topic 1 : Government Spending and Taxation79 Questions
Special Topic 2 : The Economics of Social Security54 Questions
Special Topic 3 : The Stock Market: Its Function, Performance, and Potential as an Investment Opportunity70 Questions
Special Topic 4 : Great Debates in Economics: Keynes Versus Hayek8 Questions
Special Topic 5 : The Crisis of 2008: Causes and Lessons for the Future64 Questions
Special Topic 6 : Lessons from the Great Depression60 Questions
Special Topic 7 : Lessons from Japan and Canada72 Questions
Special Topic 8 : The Federal Budget and the National Debt97 Questions
Special Topic 9 : The Economics of Healthcare68 Questions
Special Topic 10 : Education: Problems and Performance60 Questions
Special Topic 11 : Earnings Differences Between Men and Women47 Questions
Special Topic 12 : Do Labor Unions Increase the Wages of Workers?74 Questions
Special Topic 13 : The Question of Resource Exhaustion61 Questions
Special Topic 14 : Difficult Environmental Cases and the Role of Government63 Questions
Select questions type
Use the figure below to answer the following question(s).
Figure 10-15
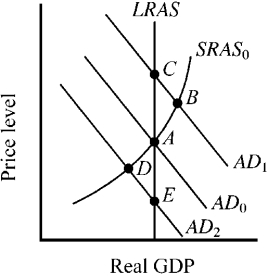 -The economy's short-run (SRAS ) and long-run (LRAS) aggregate supply curves are shown in Figure 10-15, along with three alternative aggregate demand curves and the accompanying equilibrium points. At which point will resource prices naturally tend to increase?
Free
(Multiple Choice)
4.7/5  (43)
(43)
Correct Answer: Verified
B
Which of the following will most likely occur in the United States as the result of an unexpected rapid growth in real income in Canada and Mexico?
Free
(Multiple Choice)
4.9/5 (39)
Correct Answer:Verified
A
If a currency appreciates, a country's net exports
Free
(Multiple Choice)
4.9/5 (38)
Correct Answer:Verified
C
Which of the following will cause an increase in aggregate demand within the AS/AD model?
(Multiple Choice)
4.8/5 (36)
Which of the following reduced aggregate demand and thereby contributed to the crisis of 2008?
(Multiple Choice)
4.8/5 (39)
During the past 50 years, the production possibilities of the United States have expanded, increasing both short-run and long-run aggregate supply. Other things constant, this would lead to
(Multiple Choice)
4.8/5 (38)
If there is an unanticipated decrease in aggregate demand, which of the following is most likely to occur?
(Multiple Choice)
4.7/5 (26)
Which of the following is most likely to accompany a fully anticipated reduction in short-run aggregate supply?
(Multiple Choice)
4.7/5 (32)
How will an increase in the world price of crude oil influence the economy of an oil-importing country such as the United States?
(Multiple Choice)
4.9/5 (37)
The situation in which actual output exceeds potential output
(Multiple Choice)
4.8/5 (35)
When the economy is operating at an output rate less than full-employment capacity,
(Multiple Choice)
4.7/5 (33)
Use the figure below to answer the following question(s).
Figure 10-7
 -If the economy were operating at point a in Figure 10-8, the real rate of interest would tend to
(Multiple Choice)
5.0/5 (38)
Which of the following is most likely to result in a temporary spurt in the growth of real output that cannot be maintained in the long run?
(Multiple Choice)
4.8/5 (36)
Which of the following was a contributing factor to the instability of 2002 to 2008?
(Multiple Choice)
4.7/5 (40)
The short-run effects of a favorable supply shock will include
(Multiple Choice)
4.9/5 (35)
During the 1990s, a financial crisis spread throughout Asia causing those economies to drop into recessions. Other things constant, how would such a decrease in the income of foreign trading partners have influenced the price level and output of the United States?
(Multiple Choice)
4.7/5 (30)
Under which of the following conditions will a change in government purchases have the greatest effect on the economy in the short run?
(Multiple Choice)
4.8/5 (34)
Within the AD/AS model, how does an economy adjust to an output beyond its long-run capacity as a result of an unanticipated increase in aggregate demand?
(Multiple Choice)
4.9/5 (34)
Use the figure below to answer the following question(s).
Figure 10-15
-The economy's short-run (SRAS ) and long-run (LRAS) aggregate supply curves are shown in Figure 10-15, along with three alternative aggregate demand curves and the accompanying equilibrium points. At which point will resource prices naturally tend to decrease?
(Multiple Choice)
4.7/5 (35)
Filters
- Essay(0)
- Multiple Choice(0)
- Short Answer(0)
- True False(0)
- Matching(0)