Exam 10: Determining How Costs Behave
Exam 1: The Manager and Management Accounting195 Questions
Exam 2: An Introduction to Cost Terms and Purposes224 Questions
Exam 3: Cost-Volume-Profit Analysis211 Questions
Exam 4: Job Costing203 Questions
Exam 5: Activity-Based Costing and Activity-Based Management176 Questions
Exam 6: Master Budget and Responsibility Accounting226 Questions
Exam 7: Flexible Budgets, Direct-Cost Variances, and Management Control181 Questions
Exam 8: Flexible Budgets, Overhead Cost Variances, and Management Control176 Questions
Exam 9: Inventory Costing and Capacity Analysis210 Questions
Exam 10: Determining How Costs Behave192 Questions
Exam 11: Decision Making and Relevant Information218 Questions
Exam 12: Strategy, Balanced Scorecard, and Strategic Profitability Analysis172 Questions
Exam 13: Pricing Decisions and Cost Management210 Questions
Exam 14: Cost Allocation, Customer-Profitability Analysis, and Sales-Variance Analysis167 Questions
Exam 15: Allocation of Support-Department Costs, Common Costs, and Revenues150 Questions
Exam 16: Cost Allocation: Joint Products and Byproducts151 Questions
Exam 17: Process Costing149 Questions
Exam 18: Spoilage, Rework, and Scrap153 Questions
Exam 19: Balanced Scorecard: Quality and Time150 Questions
Exam 20: Inventory Management, Just-in-Time, and Simplified Costing Methods150 Questions
Exam 21: Capital Budgeting and Cost Analysis151 Questions
Exam 22: Management Control Systems, Transfer Pricing, and Multinational Considerations151 Questions
Exam 23: Performance Measurement, Compensation, and Multinational Considerations150 Questions
Select questions type
For Heavy Manufacturing Company, labor-hours are 48,000 and wages $156,000 at the high point of the relevant range, and labor-hours are 32,000 and wages $112,000 at the low point of the relevant range.
What is the estimated total labor costs at Heavy Manufacturing Company when 11,400 labor-hours are used?
(Multiple Choice)
4.7/5  (40)
(40)
For Heavy Manufacturing Company, labor-hours are 40,000 and wages $184,000 at the high point of the relevant range, and labor-hours are 24,000 and wages $120,000 at the low point of the relevant range.
What is the constant?
(Multiple Choice)
4.8/5 (35)
Machine-hours is a more economically plausible cost driver of machine maintenance than number of direct manufacturing labor-hours.
(True/False)
4.8/5 (42)
Regression analysis is a statistical method that measures the average amount of change in the dependent variable associated with a unit change in one or more independent variables.
(True/False)
4.7/5 (32)
Taunton Company uses the high-low method to estimate its cost function. The information for 2017 is provided below:
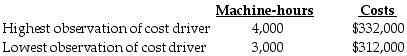 What is the estimated cost function for the above data?
(Multiple Choice)
4.8/5 (38)
To complete the first setup on a new machine took an employee 320 minutes. Using an 70% cumulative average-time learning curve indicates that the second setup on the new machine is expected to take ________.
(Multiple Choice)
4.8/5 (41)
A particular cost item could be variable for one cost object and fixed for another cost object.
(True/False)
4.9/5 (30)
Crimson Services, Inc., employs 8 individuals. They are all paid $16.50 per hour. How would total costs of personnel be classified?
(Multiple Choice)
4.9/5 (34)
A plot of data that results in one extreme observation most likely indicates that ________.
(Multiple Choice)
4.8/5 (31)
It is appropriate to incorporate expected learning-curve efficiencies when evaluating performance.
(True/False)
4.8/5 (34)
The standard error of the estimated coefficient indicates how much the estimated value, b, is likely to be affected by random factors.
(True/False)
4.9/5 (40)
In estimating a cost function using quantitative analysis, the dependent variable is the factor used to predict the independent variable.
(True/False)
4.9/5 (35)
A plot of cost driver data and cost data may show all but the following:
(Multiple Choice)
4.9/5 (40)
In the estimation of a cost function using quantitative analysis, the independent variable ________.
(Multiple Choice)
4.8/5 (45)
The cumulative average-time learning model with a 85% learning curve indicates that if it takes 200 minutes to manufacture the first unit of a new model, then the second unit will take only 170 minutes to manufacture.
(True/False)
4.8/5 (44)
The account analysis method estimates cost functions by classifying various cost accounts as variable, fixed, or mixed with respect to the identified level of activity.
(True/False)
4.8/5 (49)
Data collection problems can arise when extreme values of observations occur.
(True/False)
4.8/5 (32)
Filters
- Essay(0)
- Multiple Choice(0)
- Short Answer(0)
- True False(0)
- Matching(0)