Exam 8: The Discovery of Production and Its Technology
Exam 1: Economics and Institutions: a Shift of Emphasis40 Questions
Exam 2: Consumers and Their Preferences40 Questions
Exam 3: Utilities Indifference Curves40 Questions
Exam 4: Demand and Behavior in Markets40 Questions
Exam 5: Some Applications of Consumer Demand, and Welfare Analysis40 Questions
Exam 6: Uncertainty and the Emergence of Insurance40 Questions
Exam 7: Uncertainty Applications and Criticisms40 Questions
Exam 8: The Discovery of Production and Its Technology40 Questions
Exam 9: Cost and Choice39 Questions
Exam 10: Cost Curves40 Questions
Exam 11: Game Theory and the Tools of Strategic Business Analysis39 Questions
Exam 12: Decision Making Over Time39 Questions
Exam 13: The Internal Organization of the Firm39 Questions
Exam 14: Perfectly Competitive Markets: Short-Run Analysis40 Questions
Exam 15: Competitive Markets in the Long Run40 Questions
Exam 16: Market Institutions and Auctions40 Questions
Exam 17: The Age of Entrepreneurship: Monopoly40 Questions
Exam 18: Natural Monopoly and the Economics of Regulation40 Questions
Exam 19: The World of Oligopoly: Preliminaries to Successful Entry39 Questions
Exam 20: Market Entry and the Emergence of Perfect Competition40 Questions
Exam 21: The Problem of Exchange40 Questions
Exam 22: General Equilibrium and the Origins of the Free Market and Interventionist Ideologies40 Questions
Exam 23: Moral Hazard and Adverse Selection: Informational Market Failures40 Questions
Exam 24: Externalities: the Free Market Interventionist Battle Continues40 Questions
Exam 25: Public Goods, the Consequences of Strategic Voting Behavior, and the Role of Government40 Questions
Exam 26: Input Markets and the Origins of Class Conflict40 Questions
Select questions type
Any return above the normal profit to an entrepreneur is known as
(Multiple Choice)
4.9/5  (37)
(37)
The rate at which one input can be substituted for another while keeping the output produced constant is the marginal rate of
(Multiple Choice)
4.8/5 (40)
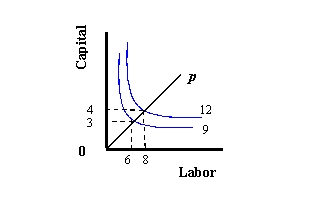
Exhibit 8-1
(a)
 (b)
(b)
 (c)
(c)
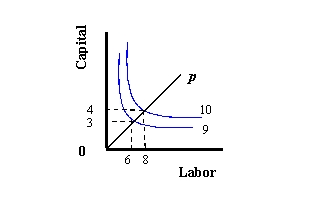 -Refer to Exhibit 8-1. Which graph depicts constant returns to scale?
(Multiple Choice)
4.8/5 (36)
The amount by which output would increase if we added one more unit of capital to production, holding all other inputs fixed is called the
(Multiple Choice)
4.7/5 (36)
A period of time long enough to vary all factors of production is known as the
(Multiple Choice)
4.8/5 (45)
A production function is a function the describes the __________ amouint of _________ a producer can produce given a certain level of _________.
(Multiple Choice)
4.8/5 (43)
The assumption that states that, if we can produce a cetain output with a given combination of inputs, then with those inputs we can always produce strictly less is called the subtractivity assumption.
(True/False)
4.9/5 (40)
(a)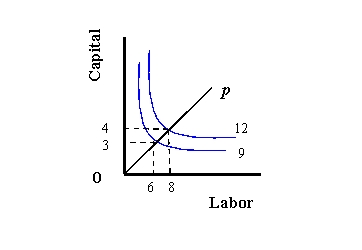 (b)
(b)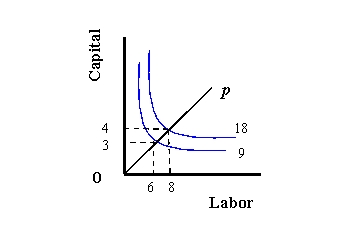 (c)
(c) -Refer to Exhibit 8-1. Describe the returns to scale for each graph. Explain your answers.
(Essay)
4.9/5 (35)
Describe some similarities between the theory of the producer and the theory of the consumer.
(Essay)
4.8/5 (45)
The short run is the time period during which at least one factor of production is fixed.
(True/False)
4.9/5 (37)
Exhibit 8-1
(a)
(b)
(c)
-Refer to Exhibit 8-1. Which graph depicts decreasing returns to scale?
(Multiple Choice)
4.8/5 (38)
The assumption that states that you cannot run a production process in reverse is called the
(Multiple Choice)
5.0/5 (37)
The decrease in the rate that output grows when we increase the usage of one factor, but hold the usage of all others constant is known as
(Multiple Choice)
4.7/5 (35)
Decreasing returns to scale is a feature of a technology that is such that, when all inputs are increased by a fixed multiple λ, output increases by less than that multiple.
(True/False)
4.8/5 (42)
A variable factor of production is a factor of production whose level
(Multiple Choice)
4.8/5 (35)
A factor of production whose level cannot be adjusted in the time period under investigation is a fixed factor of production.
(True/False)
4.7/5 (36)
The marginal product curve represents how much output we get at different levels of labor inputs holding capital fixed at a given level.
(True/False)
4.9/5 (31)
If all inputs are doubled and the resulting output increases by less than a factor of two, the technology features
(Multiple Choice)
4.7/5 (36)
Filters
- Essay(0)
- Multiple Choice(0)
- Short Answer(0)
- True False(0)
- Matching(0)