Exam 1: A: Appendix: Applying Graphs to Economics
Exam 1: Introducing the Economic Way of Thinking177 Questions
Exam 1: A: Appendix: Applying Graphs to Economics69 Questions
Exam 2: Production Possibilities,Opportunity Cost,and Economic Growth200 Questions
Exam 3: Part 1: Market Demand and Supply250 Questions
Exam 3: Part 2: Market Demand and Supply106 Questions
Exam 4: Markets in Action250 Questions
Exam 5: Price Elasticity of Demand177 Questions
Exam 6: Production Costs249 Questions
Exam 7: Perfect Competition222 Questions
Exam 8: Monopoly170 Questions
Exam 9: Monopolistic Competition and Oligopoly161 Questions
Exam 10: Labor Markets and Income Distribution180 Questions
Exam 11: Gross Domestic Product202 Questions
Exam 12: Business Cycles and Unemployment194 Questions
Exam 13: Inflation127 Questions
Exam 14: Aggregate Demand and Supply188 Questions
Exam 14: A: Appendix: The Self-Correcting Aggregate Demand and Supply Model83 Questions
Exam 15: Fiscal Policy201 Questions
Exam 16: The Public Sector127 Questions
Exam 17: Federal Deficits,Surpluses,and the National Debt97 Questions
Exam 18: Money and the Federal Reserve System154 Questions
Exam 19: Money Creation246 Questions
Exam 20: Monetary Policy214 Questions
Exam 20: A: Appendix: Policy Disputes Using the Self-Correcting Aggregate Demand and Supply Model31 Questions
Exam 21: International Trade and Finance246 Questions
Exam 22: Economies in Transition104 Questions
Exam 23: Growth and the Less-Developed Countries116 Questions
Select questions type
Exhibit 1A-5 Straight line
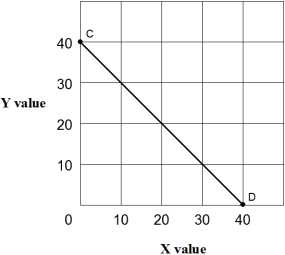 -As shown in Exhibit 1A-5,the slope of straight line CD:
Free
(Multiple Choice)
4.9/5  (36)
(36)
Correct Answer: Verified
D
A two-dimensional graph can only represent the relationship between two variables.
Free
(True/False)
4.9/5 (32)
Correct Answer:Verified
False
A downward-sloping straight line exhibits a direct relationship between two variables.
Free
(True/False)
4.7/5 (38)
Correct Answer:Verified
False
Exhibit 1A-4 Straight line
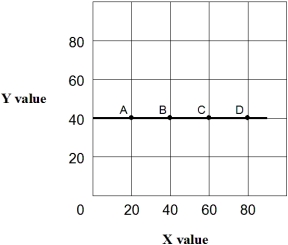 -In Exhibit 1A-4,as X increases along the horizontal axis,corresponding to points A-D on the line,the Y value remains unchanged at 40 units.The relationship between the X and Y variables is:
(Multiple Choice)
4.8/5 (31)
Exhibit 1A-6 Straight line
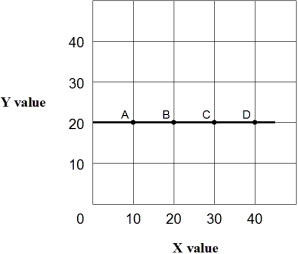 -In Exhibit 1A-6,the slope of the straight line A-D is:
(Multiple Choice)
4.9/5 (37)
Exhibit 1A-3 Straight line
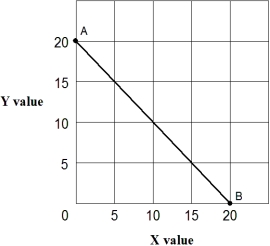 -In Exhibit 1A-3,the slope of straight line AB is:
(Multiple Choice)
4.8/5 (41)
A straight line or curve can shift when a factor not included on the vertical axis or horizontal axis changes.
(True/False)
4.9/5 (37)
An upward-sloping straight line exhibits a direct relationship between two variables.
(True/False)
4.8/5 (33)
When an inverse relationship is graphed,the resulting line or curve is:
(Multiple Choice)
4.7/5 (46)
Exhibit 1A-6 Straight line
-In Exhibit 1A-6,the slope of straight line A-D is:
(Multiple Choice)
4.8/5 (36)
The slope of a line is calculated as the ratio of the "rise" over the "run".
(True/False)
4.7/5 (34)
Exhibit 1A-7 Straight line relationship
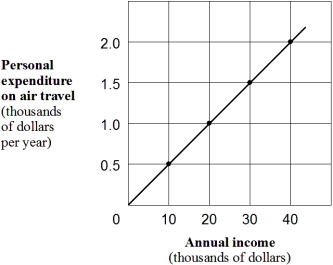 -Which of the following would cause a shift in the relationship shown in Exhibit 1A-7?
(Multiple Choice)
4.7/5 (30)
Exhibit 1A-3 Straight line
-Straight line AB in Exhibit 1A-3 shows that:
(Multiple Choice)
4.9/5 (46)
Direct relationships are illustrated using upward-sloping lines and curves.
(True/False)
4.7/5 (33)
Exhibit 1A-4 Straight line
-In Exhibit 1A-4,the slope of straight line A-D is:
(Multiple Choice)
4.9/5 (28)
Suppose two variables are directly related.If one variable rises,then the other variable:
(Multiple Choice)
4.9/5 (35)
Filters
- Essay(0)
- Multiple Choice(0)
- Short Answer(0)
- True False(0)
- Matching(0)