Exam 22:Understanding Graphs
Exam 1: The Art and Science of Economic Analysis147 Questions
Exam 2: Economic Tools and Economics Systems195 Questions
Exam 3: Economic Decision Makers200 Questions
Exam 4: Demand Supply and Markets232 Questions
Exam 5: Introduction to Macroeconomics165 Questions
Exam 6: Tracking the Us Economy213 Questions
Exam 7: Unemployment and Inflation201 Questions
Exam 8: Productivity and Growth124 Questions
Exam 9: Aggregate Expenditure187 Questions
Exam 10: Aggregate Expenditure and Aggregate Demand160 Questions
Exam 11: Aggregate Supply213 Questions
Exam 12: Fiscal Policy242 Questions
Exam 13: Federal Budgets and Public Policy158 Questions
Exam 14: Money and the Financial System209 Questions
Exam 15: Banking and the Money Supply229 Questions
Exam 25: The Algebra of Income and Expenditure17 Questions
Exam 16: Monetary Theory and Policy185 Questions
Exam 17: Macro Policy Debate: Active or Passive190 Questions
Exam 26: The Algebra of Demand-Side Equilibrium22 Questions
Exam 18: International Trade163 Questions
Exam 19: International Finance231 Questions
Exam 20: Economic Development110 Questions
Exam 21: National Income Accounts34 Questions
Exam 22:Understanding Graphs65 Questions
Exam 23:Variable Net Exports27 Questions
Exam 24: Variable Net Exports Revisited35 Questions
Select questions type
Exhibit 1-9
 -The numerical value of the slope of a line depends in part on the units of measurement used.
Free
(True/False)
4.8/5  (34)
(34)
Correct Answer: Verified
True
A downward-sloping straight line has a decreasing slope.
Free
(True/False)
4.7/5 (34)
Correct Answer:Verified
False
A U-shaped curve has a positive slope everywhere.
Free
(True/False)
4.9/5 (36)
Correct Answer:Verified
False
On a graph with x on the horizontal axis and y on the vertical axis, the origin is
(Multiple Choice)
4.8/5 (31)
A curved line may have a positive slope or a negative slope, but it cannot have both positive and negative areas of slope.
(True/False)
4.8/5 (29)
Exhibit 1-16 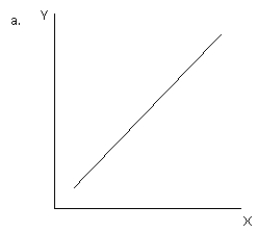
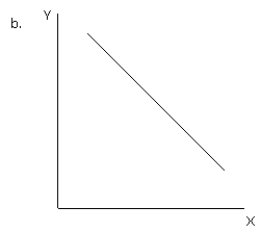
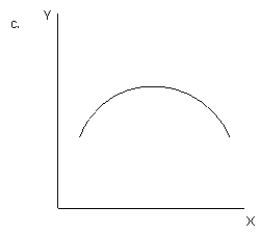
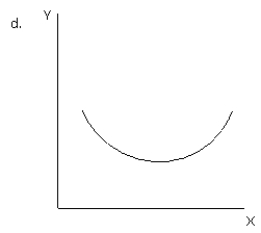
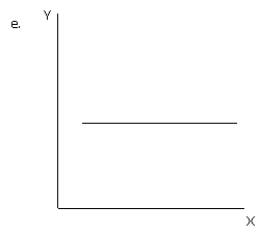 -Refer to Exhibit 1-16. Which graph illustrates a positive relationship between variable X and variable Y initially but then a negative relationship?
(Multiple Choice)
4.7/5 (33)
Exhibit 1-16
-Refer to Exhibit 1-16. Which graph illustrates a negative relationship between variable X and variable Y initially but then a positive relationship?
(Multiple Choice)
4.8/5 (39)
Exhibit 1-8 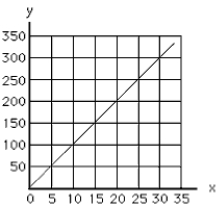 -Ron weighs 150 pounds. A graph relating Ron's weight on the vertical axis to Nancy's consumption of ice cream on the horizontal axis would be
(Multiple Choice)
4.8/5 (40)
Suppose the cost of producing copper tubing is $1 per foot. If production costs were measured on the vertical axis and quantity of copper tubing were measured on the horizontal axis, which of the following lines would have the smallest slope?
(Multiple Choice)
4.9/5 (39)
Moderate exercise is better than none, but excessive exercise is harmful. What is the shape of the graph of health benefits versus hours of exercise per week if health benefits are measured on the vertical axis and exercise is measured on the horizontal axis?
(Multiple Choice)
4.7/5 (31)
Exhibit 1-14 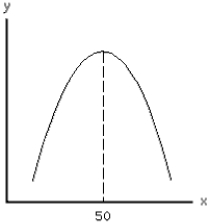 -The part of a graph that is most applicable to marginal analysis is the
(Multiple Choice)
4.9/5 (37)
Filters
- Essay(0)
- Multiple Choice(0)
- Short Answer(0)
- True False(0)
- Matching(0)