Exam 22:Understanding Graphs
Exam 1: The Art and Science of Economic Analysis147 Questions
Exam 2: Economic Tools and Economics Systems195 Questions
Exam 3: Economic Decision Makers200 Questions
Exam 4: Demand Supply and Markets232 Questions
Exam 5: Introduction to Macroeconomics165 Questions
Exam 6: Tracking the Us Economy213 Questions
Exam 7: Unemployment and Inflation201 Questions
Exam 8: Productivity and Growth124 Questions
Exam 9: Aggregate Expenditure187 Questions
Exam 10: Aggregate Expenditure and Aggregate Demand160 Questions
Exam 11: Aggregate Supply213 Questions
Exam 12: Fiscal Policy242 Questions
Exam 13: Federal Budgets and Public Policy158 Questions
Exam 14: Money and the Financial System209 Questions
Exam 15: Banking and the Money Supply229 Questions
Exam 25: The Algebra of Income and Expenditure17 Questions
Exam 16: Monetary Theory and Policy185 Questions
Exam 17: Macro Policy Debate: Active or Passive190 Questions
Exam 26: The Algebra of Demand-Side Equilibrium22 Questions
Exam 18: International Trade163 Questions
Exam 19: International Finance231 Questions
Exam 20: Economic Development110 Questions
Exam 21: National Income Accounts34 Questions
Exam 22:Understanding Graphs65 Questions
Exam 23:Variable Net Exports27 Questions
Exam 24: Variable Net Exports Revisited35 Questions
Select questions type
The slope of a U-shaped curve is infinity at the bottom of the U.
(True/False)
4.8/5  (32)
(32)
A functional relationship exists between two variables if the value of one variable depends on the value of the other variable.
(True/False)
4.9/5 (40)
If the dependent variable Y is directly related to the independent variable X, this means that changes in X cause changes in Y.
(True/False)
4.8/5 (37)
Exhibit 1-9
 -Using the values in Exhibit 1-7, calculate the slope of a line graphed with x on the horizontal axis and y on the vertical axis.
(Multiple Choice)
4.9/5 (40)
Any point on a graph represents a combination of particular values of two variables.
(True/False)
4.9/5 (37)
The slope of an inverted U-shaped curve is infinity at the top of the curve.
(True/False)
5.0/5 (48)
Exhibit 1-16 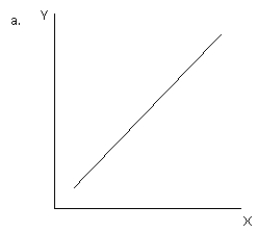
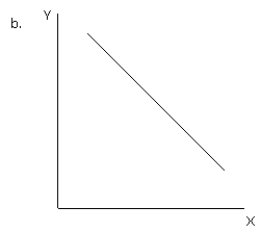
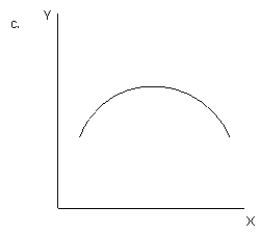
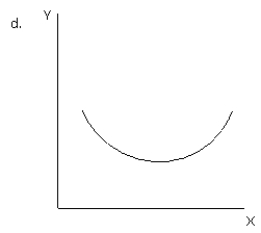
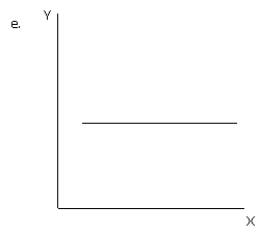 -Refer to exhibit 1-16. Which of the graphs illustrates no relationship between variable X and variable Y?
(Multiple Choice)
4.8/5 (34)
The statement that there is a direct relation between x and y means that
(Multiple Choice)
4.9/5 (38)
Exhibit 1-5 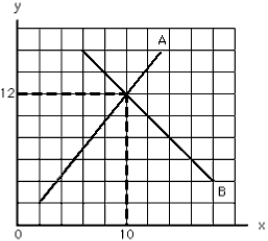 -In Exhibit 1-2, curve A has a __________ slope that is __________ at every point.
(Multiple Choice)
4.8/5 (34)
Exhibit 1-13 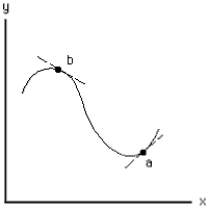 -Compare the slopes of the tangents at points a and b in Exhibit 1-11. Which of the following statements is true?
(Multiple Choice)
4.9/5 (39)
Filters
- Essay(0)
- Multiple Choice(0)
- Short Answer(0)
- True False(0)
- Matching(0)