Exam 5: Introduction to Macroeconomics
Exam 1: The Art and Science of Economic Analysis147 Questions
Exam 2: Economic Tools and Economics Systems195 Questions
Exam 3: Economic Decision Makers200 Questions
Exam 4: Demand Supply and Markets232 Questions
Exam 5: Introduction to Macroeconomics165 Questions
Exam 6: Tracking the Us Economy213 Questions
Exam 7: Unemployment and Inflation201 Questions
Exam 8: Productivity and Growth124 Questions
Exam 9: Aggregate Expenditure187 Questions
Exam 10: Aggregate Expenditure and Aggregate Demand160 Questions
Exam 11: Aggregate Supply213 Questions
Exam 12: Fiscal Policy242 Questions
Exam 13: Federal Budgets and Public Policy158 Questions
Exam 14: Money and the Financial System209 Questions
Exam 15: Banking and the Money Supply229 Questions
Exam 25: The Algebra of Income and Expenditure17 Questions
Exam 16: Monetary Theory and Policy185 Questions
Exam 17: Macro Policy Debate: Active or Passive190 Questions
Exam 26: The Algebra of Demand-Side Equilibrium22 Questions
Exam 18: International Trade163 Questions
Exam 19: International Finance231 Questions
Exam 20: Economic Development110 Questions
Exam 21: National Income Accounts34 Questions
Exam 22:Understanding Graphs65 Questions
Exam 23:Variable Net Exports27 Questions
Exam 24: Variable Net Exports Revisited35 Questions
Select questions type
Long-term growth in production can be partially explained by
(Multiple Choice)
4.9/5  (39)
(39)
An increase in government spending, other things constant, would cause a
(Multiple Choice)
4.8/5 (38)
Certain economic activities signal forthcoming changes in the economy. These are known as the
(Multiple Choice)
4.8/5 (34)
The economy is so __________ that we need to __________ matters.
(Multiple Choice)
4.9/5 (32)
Given the aggregate demand curve, an increase in aggregate supply would raise real GDP and reduce the price level.
(True/False)
4.7/5 (28)
Which of the following is not the proper subject matter for macroeconomics?
(Multiple Choice)
4.7/5 (33)
In the history of the U.S. economy, which economic era saw both high unemployment and high inflation at the same time?
(Multiple Choice)
4.7/5 (37)
Exhibit 5-2 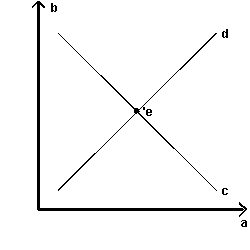 -Refer to Exhibit 5-2. Which line or point represents aggregate demand?
(Multiple Choice)
4.8/5 (34)
In U.S. history, recessions have usually lasted longer than expansion periods.
(True/False)
4.9/5 (36)
The laissez-faire approach popular before the Great Depression influenced the U.S. government to see business downturns as
(Multiple Choice)
4.8/5 (30)
Exhibit 5-1 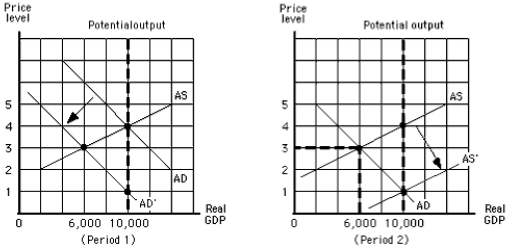
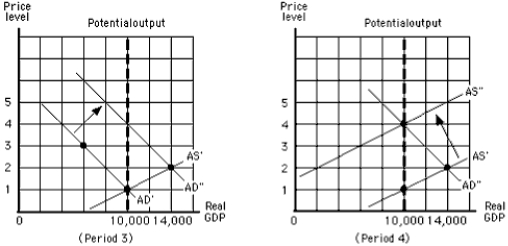 -In Exhibit 5-1, from the beginning of period 1 to the end of period 2, nominal GDP went from
(Multiple Choice)
4.7/5 (30)
Given the following aggregate demand and aggregate supply schedules, determine the equilibrium level of prices and output. 
(Multiple Choice)
5.0/5 (33)
One explanation for the negative slope of the aggregate demand curve is that
(Multiple Choice)
4.9/5 (31)
A period of sustained growth of output in the economy is referred to as a(n)
(Multiple Choice)
4.8/5 (29)
Filters
- Essay(0)
- Multiple Choice(0)
- Short Answer(0)
- True False(0)
- Matching(0)