Exam 12: Consumption, Real GDP, and the Multiplier
Exam 1: The Nature of Economics347 Questions
Exam 2: Scarcity and the World of Trade-Offs412 Questions
Exam 3: Demand and Supply448 Questions
Exam 4: Extensions of Demand and Supply Analysis399 Questions
Exam 5: Public Spending and Public Choice359 Questions
Exam 6: Funding the Public Sector202 Questions
Exam 7: The Macroeconomy: Unemployment, Inflation, and Deflation412 Questions
Exam 8: Measuring the Economys Performance413 Questions
Exam 9: Global Economic Growth and Development282 Questions
Exam 10: Real GDP and the Price Level in the Long Run290 Questions
Exam 11: Classical and Keynesian Macro Analyses365 Questions
Exam 12: Consumption, Real GDP, and the Multiplier445 Questions
Exam 13: Fiscal Policy273 Questions
Exam 14: Deficit Spending and the Public Debt145 Questions
Exam 15: Money, Banking, and Central Banking517 Questions
Exam 16: Domestic and International Dimensions of Monetary Policy357 Questions
Exam 17: Stabilization in an Integrated World Economy306 Questions
Exam 18: Policies and Prospects for Global Economic Growth216 Questions
Exam 19: Demand and Supply Elasticity413 Questions
Exam 20: Consumer Choice458 Questions
Exam 21: Rents, Profits, and the Financial Environment of Business445 Questions
Exam 22: The Firm: Cost and Output Determination387 Questions
Exam 23: Perfect Competition431 Questions
Exam 24: Monopoly386 Questions
Exam 25: Monopolistic Competition309 Questions
Exam 26: Oligopoly and Strategic Behavior306 Questions
Exam 27: Regulation and Antitrust Policy in a Globalized Economy309 Questions
Exam 28: The Labor Market: Demand, Supply and Outsourcing376 Questions
Exam 29: Unions and Labor Market Monopoly Power318 Questions
Exam 30: Income, Poverty, and Health Care302 Questions
Exam 31: Environmental Economics300 Questions
Exam 32: Comparative Advantage and the Open Economy314 Questions
Exam 33: Exchange Rates and the Balance of Payments300 Questions
Select questions type
An increase in the interest rate will cause
Free
(Multiple Choice)
4.8/5  (35)
(35)
Correct Answer: Verified
B
If the marginal propensity to consume (MPC) is 0.75 and government purchases increase by $200 billion, then
Free
(Multiple Choice)
4.9/5 (40)
Correct Answer:Verified
A
All of the following would cause the investment function relating investment to the interest rate to shift EXCEPT
(Multiple Choice)
4.9/5 (41)
Which of the following is NOT included in the flow of investment spending that is part of total planned expenditures in the economy?
(Multiple Choice)
4.7/5 (41)
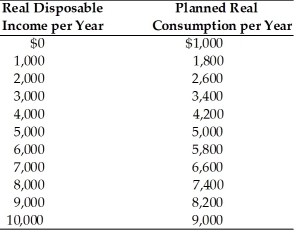 -In the above table, the average propensity to save when disposable income is $5,000 is
(Multiple Choice)
5.0/5 (41)
Because a decrease in real autonomous spending results in a ________ in the price level, the ultimate effect on real GDP is ________ that predicted by the multiplier.
(Multiple Choice)
5.0/5 (38)
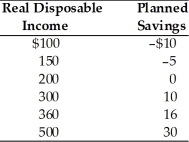 -According to the above table, the value of MPS is ________.
(Multiple Choice)
4.7/5 (37)
The investment schedule is downward sloping and the saving schedule is upward sloping with respect to the interest rate. Suppose the equilibrium real investment per year at the market rate of interest is $1 trillion. How is this represented when real national income per year is on the horizontal axis? How is this incorporated into the consumption-function graph?
(Essay)
4.8/5 (35)
 -Refer to the above table. The table gives the combinations of real disposable income and real consumption for a college student for a year. What does planned real saving equal when real disposable income equals $6,000?
(Multiple Choice)
4.8/5 (36)
Filters
- Essay(0)
- Multiple Choice(0)
- Short Answer(0)
- True False(0)
- Matching(0)