Exam 12: Consumption, Real GDP, and the Multiplier
Exam 1: The Nature of Economics347 Questions
Exam 2: Scarcity and the World of Trade-Offs412 Questions
Exam 3: Demand and Supply448 Questions
Exam 4: Extensions of Demand and Supply Analysis399 Questions
Exam 5: Public Spending and Public Choice359 Questions
Exam 6: Funding the Public Sector202 Questions
Exam 7: The Macroeconomy: Unemployment, Inflation, and Deflation412 Questions
Exam 8: Measuring the Economys Performance413 Questions
Exam 9: Global Economic Growth and Development282 Questions
Exam 10: Real GDP and the Price Level in the Long Run290 Questions
Exam 11: Classical and Keynesian Macro Analyses365 Questions
Exam 12: Consumption, Real GDP, and the Multiplier445 Questions
Exam 13: Fiscal Policy273 Questions
Exam 14: Deficit Spending and the Public Debt145 Questions
Exam 15: Money, Banking, and Central Banking517 Questions
Exam 16: Domestic and International Dimensions of Monetary Policy357 Questions
Exam 17: Stabilization in an Integrated World Economy306 Questions
Exam 18: Policies and Prospects for Global Economic Growth216 Questions
Exam 19: Demand and Supply Elasticity413 Questions
Exam 20: Consumer Choice458 Questions
Exam 21: Rents, Profits, and the Financial Environment of Business445 Questions
Exam 22: The Firm: Cost and Output Determination387 Questions
Exam 23: Perfect Competition431 Questions
Exam 24: Monopoly386 Questions
Exam 25: Monopolistic Competition309 Questions
Exam 26: Oligopoly and Strategic Behavior306 Questions
Exam 27: Regulation and Antitrust Policy in a Globalized Economy309 Questions
Exam 28: The Labor Market: Demand, Supply and Outsourcing376 Questions
Exam 29: Unions and Labor Market Monopoly Power318 Questions
Exam 30: Income, Poverty, and Health Care302 Questions
Exam 31: Environmental Economics300 Questions
Exam 32: Comparative Advantage and the Open Economy314 Questions
Exam 33: Exchange Rates and the Balance of Payments300 Questions
Select questions type
If business executives become more optimistic about the future, we would expect that
(Multiple Choice)
4.7/5  (35)
(35)
If your real disposable income goes up by $1,000 per week, and your real consumption spending goes up by $800 per week, you have a marginal propensity to consume of
(Multiple Choice)
4.8/5 (36)
Which of the following represents the relationship between disposable income (DI), consumption (C), and saving (S)?
(Multiple Choice)
4.7/5 (28)
The relationship that tells us how much a person intends to spend at various levels of income is
(Multiple Choice)
4.8/5 (40)
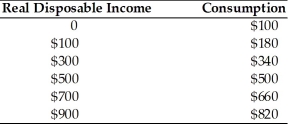
 -Refer to the above table. The table gives the combinations of real disposable income and real consumption for a college student for a year. What is the value of the average propensity to consume when real disposable income equals $4,000?
(Multiple Choice)
4.7/5 (35)
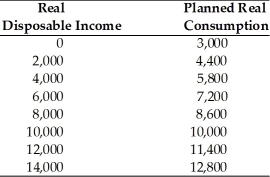
Suppose the marginal propensity to consume (MPC) is 0.8 and there is a $4,000 increase in planned investment. Given this information, real GDP will increase by
(Multiple Choice)
5.0/5 (30)
Suppose there is a $200 billion increase in government spending. We know that this increase in government spending will cause which of the following to occur?
(Multiple Choice)
4.9/5 (41)
 -In the above table, saving is positive when real disposable income is greater than
(Multiple Choice)
4.8/5 (49)
 -In the above diagram, what happens if the real GDP is $3 trillion? $5 trillion? $7 trillion? What is the equilibrium level of real GDP? Why?
(Essay)
5.0/5 (32)
Based on historical data, which of the following tended to be most variable over time?
(Multiple Choice)
4.8/5 (37)
Explain how the aggregate demand curve is related to the C + I + G + X curve.
(Essay)
4.9/5 (37)
What is the primary determinant of real saving and real consumption according to Keynes? Explain.
(Essay)
4.8/5 (43)
When the average propensity to save (APS) is 0.20, then this means
(Multiple Choice)
4.8/5 (45)
When real planned saving is greater than real planned investment spending,
(Multiple Choice)
4.9/5 (35)
The break-even point on the consumption function represents the point where
(Multiple Choice)
4.8/5 (40)
Filters
- Essay(0)
- Multiple Choice(0)
- Short Answer(0)
- True False(0)
- Matching(0)