Exam 5: Elasticity and Its Application
Exam 1: Ten Lessons From Economics149 Questions
Exam 2: Thinking Like an Economist147 Questions
Exam 3: Interdependence and the Gains From Trade153 Questions
Exam 4: The Market Forces of Supply and Demand222 Questions
Exam 5: Elasticity and Its Application181 Questions
Exam 6: Supply, Demand and Government Policies148 Questions
Exam 7: Consumers, Producers and the Efficiency of Markets177 Questions
Exam 8: Application: The Costs of Taxation141 Questions
Exam 9: Application: International Trade161 Questions
Exam 10: Externalities199 Questions
Exam 11: Public Goods and Common Resources182 Questions
Exam 12: The Design of the Tax System154 Questions
Exam 13: The Costs of Production191 Questions
Exam 14: Firms in Competitive Markets200 Questions
Exam 15: Monopoly214 Questions
Exam 16: Business Strategy184 Questions
Exam 17: Competition Policy104 Questions
Exam 18: Monopolistic Competition214 Questions
Exam 19: The Markets for the Factors of Production215 Questions
Exam 20: Earnings, Unions and Discrimination206 Questions
Exam 21: Income Inequity and Poverty111 Questions
Exam 22: The Theory of Consumer Choice161 Questions
Exam 23: Frontiers of Microeconomics120 Questions
Exam 24: Measuring a Nations Income51 Questions
Exam 25: Measuring the Cost of Living52 Questions
Exam 26: Production and Growth62 Questions
Exam 27: Saving, Investment and the Financial System62 Questions
Exam 28: The Natural Rate of Unemployment59 Questions
Exam 29: The Monetary System66 Questions
Exam 30: Inflation: Its Causes and Costs74 Questions
Exam 31: Open-Economy Macroeconomics: Basic Concepts68 Questions
Exam 32: A Macroeconomic Theory of the Open Economy64 Questions
Exam 33: Aggregate Demand and Aggregate Supply82 Questions
Exam 34: The Influence of Monetary and Fiscal Policy on Aggregate Demand73 Questions
Exam 35: The Short-Run Trade-Off Between Inflation and Unemployment58 Questions
Exam 36: Five Debates Over Macroeconomic Policy38 Questions
Select questions type
Recently, the price of a Kit Kat fell from $1.80 to $1.50. As a result, the quantity demanded of Mars Bars decreased from 1200 to 1000. What would be the appropriate elasticity to compute? What does your answer tell you?
(Essay)
4.7/5  (31)
(31)
If the price elasticity of demand is 1.5, a price decrease will cause total revenue to increase.
(True/False)
5.0/5 (32)
If an increase in the price of a good results in an increase in total revenue for the firm, then:
(Multiple Choice)
5.0/5 (27)
Table 5-2
Qualities purchased
 -Refer to Table 5-2. Good X is:
(Multiple Choice)
4.8/5 (35)
Suppose the price of product X is increased from $8.00 to $10.00 and as a result, the quantity of X demanded decreases from 1500 to 1000. Using the midpoint method, the price elasticity of demand for X in the given price range is:
(Multiple Choice)
4.9/5 (28)
If the demand for illegal drugs is inelastic, drug education campaigns should:
(Multiple Choice)
4.9/5 (38)
Table 5-1
Suppose a coffee shop faces the following demand schedule for coffee.
 -In any market, total revenue is the price:
(Multiple Choice)
4.9/5 (36)
Suppose the government increases the tax on gasoline in order to raise revenue. Since raising the gasoline tax would increase the price of gasoline, the government must be assuming that the:
(Multiple Choice)
4.8/5 (35)
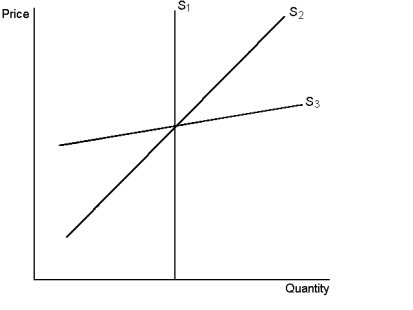
Rate the supply curves on the graph shown from shortest time frame to longest time frame. Which curve is the most inelastic? Which curve is the most elastic?
(Essay)
4.9/5 (29)
Suppose that the price of timber rises by 10 per cent and a forest-product company responds by increasing harvest by five per cent. This means that this price elasticity of supply of timber by this company is two.
(True/False)
4.8/5 (36)
The demand for fruit is generally more elastic than the demand for Australian apples
(True/False)
4.9/5 (28)
Suppose the price elasticity of demand for wine is 1.60. A 12 per cent decrease in price will result in:
(Multiple Choice)
4.8/5 (43)
Use the graph below to answer the following questions. Put the correct letter in the blank.
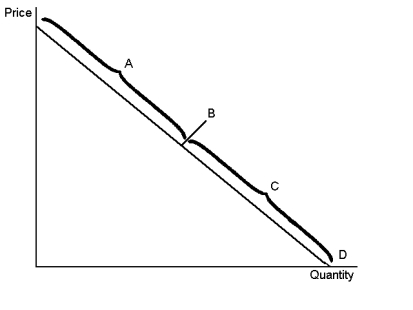 a. The elastic section of the graph is represented by section _____.
b. The inelastic section of the graph is represented by section _____.
c. The unit elastic section of the graph is represented by section _____.
d. The portion of the graph in which a decrease in price would cause total revenue to fall is _____.
e. The portion of the graph in which a decrease in price would cause total revenue to rise is _____.
f. The portion of the graph in which a decrease in price would not cause a change in total revenue is _____.
g. The section of the graph in which total revenue would be at a maximum is _____.
h. The section of the graph in which elasticity is greater than one is _____.
i. The section of the graph in which elasticity is equal to one is _____.
j. The section of the graph in which elasticity is less than one is _____.
a. The elastic section of the graph is represented by section _____.
b. The inelastic section of the graph is represented by section _____.
c. The unit elastic section of the graph is represented by section _____.
d. The portion of the graph in which a decrease in price would cause total revenue to fall is _____.
e. The portion of the graph in which a decrease in price would cause total revenue to rise is _____.
f. The portion of the graph in which a decrease in price would not cause a change in total revenue is _____.
g. The section of the graph in which total revenue would be at a maximum is _____.
h. The section of the graph in which elasticity is greater than one is _____.
i. The section of the graph in which elasticity is equal to one is _____.
j. The section of the graph in which elasticity is less than one is _____.
(Essay)
4.7/5 (29)
If sellers respond substantially to changes in the price, then:
(Multiple Choice)
4.8/5 (30)
Suppose that an increase in the price of rare cockatoos from $1000 to $1600 prompts breeders to increase the supply of these birds on the market from 600 to 1000. Using the midpoint method, what would be the elasticity of supply?
(Multiple Choice)
4.9/5 (41)
Filters
- Essay(0)
- Multiple Choice(0)
- Short Answer(0)
- True False(0)
- Matching(0)