Exam 5: Elasticity and Its Application
Exam 1: Ten Lessons From Economics149 Questions
Exam 2: Thinking Like an Economist147 Questions
Exam 3: Interdependence and the Gains From Trade153 Questions
Exam 4: The Market Forces of Supply and Demand222 Questions
Exam 5: Elasticity and Its Application181 Questions
Exam 6: Supply, Demand and Government Policies148 Questions
Exam 7: Consumers, Producers and the Efficiency of Markets177 Questions
Exam 8: Application: The Costs of Taxation141 Questions
Exam 9: Application: International Trade161 Questions
Exam 10: Externalities199 Questions
Exam 11: Public Goods and Common Resources182 Questions
Exam 12: The Design of the Tax System154 Questions
Exam 13: The Costs of Production191 Questions
Exam 14: Firms in Competitive Markets200 Questions
Exam 15: Monopoly214 Questions
Exam 16: Business Strategy184 Questions
Exam 17: Competition Policy104 Questions
Exam 18: Monopolistic Competition214 Questions
Exam 19: The Markets for the Factors of Production215 Questions
Exam 20: Earnings, Unions and Discrimination206 Questions
Exam 21: Income Inequity and Poverty111 Questions
Exam 22: The Theory of Consumer Choice161 Questions
Exam 23: Frontiers of Microeconomics120 Questions
Exam 24: Measuring a Nations Income51 Questions
Exam 25: Measuring the Cost of Living52 Questions
Exam 26: Production and Growth62 Questions
Exam 27: Saving, Investment and the Financial System62 Questions
Exam 28: The Natural Rate of Unemployment59 Questions
Exam 29: The Monetary System66 Questions
Exam 30: Inflation: Its Causes and Costs74 Questions
Exam 31: Open-Economy Macroeconomics: Basic Concepts68 Questions
Exam 32: A Macroeconomic Theory of the Open Economy64 Questions
Exam 33: Aggregate Demand and Aggregate Supply82 Questions
Exam 34: The Influence of Monetary and Fiscal Policy on Aggregate Demand73 Questions
Exam 35: The Short-Run Trade-Off Between Inflation and Unemployment58 Questions
Exam 36: Five Debates Over Macroeconomic Policy38 Questions
Select questions type
Demand is classed as elastic if the elasticity coefficient is:
(Multiple Choice)
4.8/5  (53)
(53)
Graph 5-2
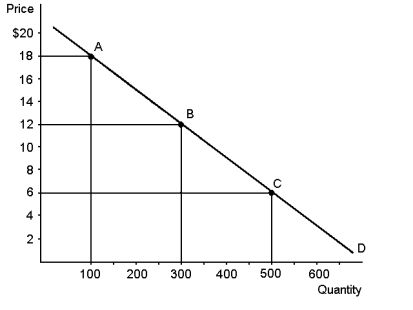 -In Graph 5-2, the elasticity of demand from point A to point B, using the midpoint method, would be:
(Multiple Choice)
4.7/5 (42)
If price changes and total revenue changes in the opposite direction, we can conclude that demand is relatively elastic.
(True/False)
5.0/5 (33)
The price elasticity of demand for a product will tend to be higher if fewer good substitutes for it are available.
(True/False)
4.8/5 (37)
Graph 5-4
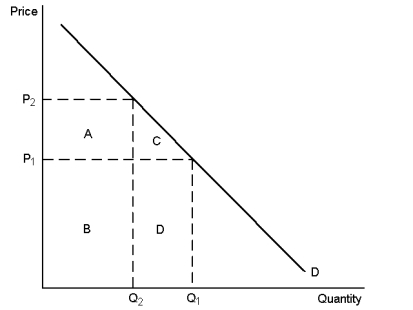 -Refer to Graph 5-4. Total revenue at P2 would be represented by area(s):
(Multiple Choice)
4.8/5 (35)
You have just been hired by a forestry company as a consultant. The company wishes to know whether increasing or decreasing A-grade log prices will increase revenue. What information do you need? Suppose you have been given this information, what would you recommend?
(Essay)
4.8/5 (34)
The discovery of a new hybrid wheat would tend to increase the supply of wheat. Under what conditions would wheat farmers realise an increase in revenue?
(Multiple Choice)
4.9/5 (37)
Use the graphs below to answer the following questions.
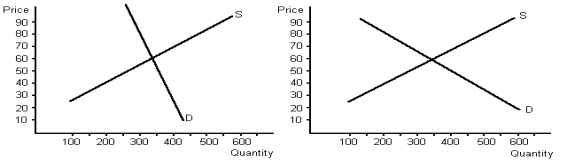 a. Determine equilibrium price and quantity for each graph.
b. Given demand and supply, what would total revenue be for each graph?
c. Assume that supply shifts to the left on both graphs by 100, raising price. Given the new equilibrium price and equilibrium quantity, what would total revenue be for each graph?
d. What do your answers to part c tell you about the relationship between elasticity of demand and total revenue?
a. Determine equilibrium price and quantity for each graph.
b. Given demand and supply, what would total revenue be for each graph?
c. Assume that supply shifts to the left on both graphs by 100, raising price. Given the new equilibrium price and equilibrium quantity, what would total revenue be for each graph?
d. What do your answers to part c tell you about the relationship between elasticity of demand and total revenue?
(Essay)
4.8/5 (42)
The demand for a good is said to be elastic if a small price decrease leads to a substantial increase in the quantity demanded.
(True/False)
4.9/5 (36)
Suppose you are the manager of a theatre. You currently charge the same admission price to all customers, regardless of age. You hire an economist to determine the price elasticity of demand for admissions by age and he tells you that at the current price, demand by adults is inelastic and demand by children is elastic. If you want to increase your total revenue by adjusting admission prices, how should they be adjusted?
(Essay)
4.8/5 (38)
Graph 5-1
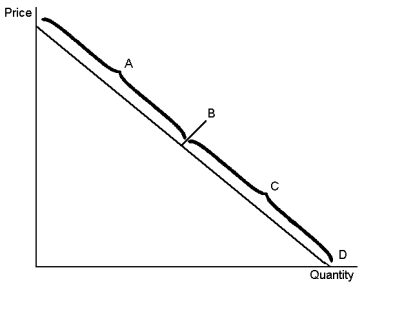 -In Graph 5-1, the section of the demand curve labelled A represents the:
(Multiple Choice)
4.7/5 (36)
The local pizza restaurant makes such great bread sticks that consumers do not respond much to a change in the price. If the owner is only interested in increasing revenue, he should:
(Multiple Choice)
4.7/5 (23)
Graph 5-4
-Refer to Graph 5-4. The total revenue at P1 is represented by area(s):
(Multiple Choice)
4.8/5 (22)
Price elasticity over any range of a demand curve is measured by the slope of the demand curve over that range.
(True/False)
4.9/5 (36)
Last year, Joan bought 50 kilograms of hamburger mince when the household income was $40 000. This year, the household income was only $30 000 and Joan bought 60 kilograms of hamburger mince. All else being constant, Joan's income elasticity of demand for hamburger is:
(Multiple Choice)
4.8/5 (29)
Filters
- Essay(0)
- Multiple Choice(0)
- Short Answer(0)
- True False(0)
- Matching(0)