Exam 6: The Sources of Growth and the Solow Model
Exam 1: The Policy and Practice of Macroeconomics84 Questions
Exam 2: Measuring Macroeconomic Data85 Questions
Exam 3: Aggregate Production and Productivity85 Questions
Exam 4: Saving and Investment in Closed and Open Economies85 Questions
Exam 5: Money and Inflation91 Questions
Exam 6: The Sources of Growth and the Solow Model88 Questions
Exam 7: Drivers of Growth: Technology, policy, and Institutions85 Questions
Exam 8: Business Cycles: an Introduction89 Questions
Exam 9: The Is Curve97 Questions
Exam 10: Monetary Policy and Aggregate Demand86 Questions
Exam 11: Aggregate Supply and the Phillips Curve85 Questions
Exam 12: The Aggregate Demand and Supply Model90 Questions
Exam 13: Macroeconomic Policy and Aggregate Demand and Supply Analysis100 Questions
Exam 14: The Financial System and Economic Growth85 Questions
Exam 15: Financial Crises and the Economy92 Questions
Exam 16: Fiscal Policy and the Government Budget92 Questions
Exam 17: Exchange Rates and International Economic Policy90 Questions
Exam 18: Consumption and Saving87 Questions
Exam 19: Investment74 Questions
Exam 20: The Labor Market, employment, and Unemployment88 Questions
Exam 21: The Role of Expectations in Macroeconomic Policy86 Questions
Exam 22: Modern Business Cycle Theory77 Questions
Select questions type
Comparing steady states,which of the following is a result of a permanent increase in the saving rate,but is not a consequence of a one-time increase in productivity?
(Multiple Choice)
4.9/5  (36)
(36)
In the Solow model,which of the following is an endogenous variable?
(Multiple Choice)
4.8/5 (35)
Solow Diagram 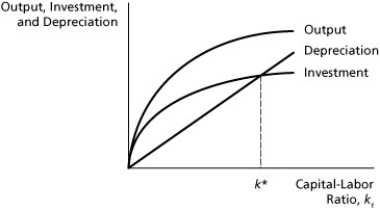 -On the diagram above,show the quantity of consumption per worker in equilibrium.If the actual capital per worker were greater than k*,would consumption be higher or lower than it is in equilibrium? Describe what would happen in an economy with such a high level of capital per worker.
(Essay)
4.8/5 (36)
Evidence of a negative correlation between income per capita and population growth rates ________.
(Multiple Choice)
4.9/5 (43)
If the contribution from capital growth equals 2 percent and the contribution from labor growth equals 4 percent,then GDP ________.
(Multiple Choice)
4.9/5 (43)
On the Solow Diagram,an increase in the saving rate is shown by ________.
(Multiple Choice)
4.8/5 (43)
Solow Diagram  -On the diagram above,show the new steady-state capital-labor ratio that results from a decrease in the saving rate.Can you say what has happened to the equilibrium level of consumption per worker?
(Essay)
4.8/5 (36)
The loss of capital due to the wearing out of machines is known as ________.
(Multiple Choice)
4.9/5 (33)
The Solow model implies that continuous growth in productivity at a rate of one percent will result in continuous growth of output per worker at a rate of 1.43%.Thus,if at a point in time output per worker is 270 and productivity rises by one percent,the resulting level of output per worker is ________.
(Multiple Choice)
5.0/5 (45)
Figure 6.1 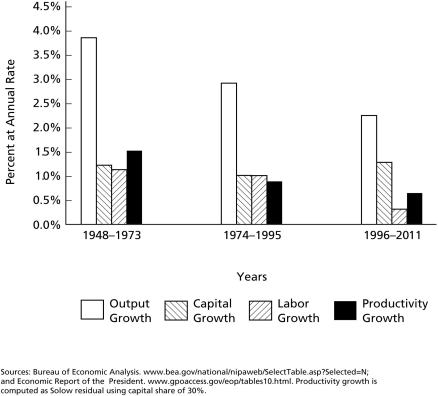 -According to Figure 6.1,the period from 1996 to 2011 is particularly remarkable for the rapid growth of ________.
(Multiple Choice)
4.8/5 (33)
If an economy initially starts away from the steady state ________.
(Multiple Choice)
4.9/5 (36)
Which of the following is the most difficult to measure? Changes in ________.
(Multiple Choice)
4.7/5 (41)
Figure 6.1
-According to Figure 6.1,the average annual rate of growth of the U.S.economy in the period 1996-2011 equalled ________.
(Multiple Choice)
4.9/5 (37)
In theory,differences in output across economies and over time might be the result of differences in either capital input,labor input,or productivity.The evidence points clearly to productivity as a more likely and powerful source of growth differences.Which aspects of the Solow growth model help to explain why the inputs of capital and labor contribute little to growth of output,relative to productivity?
(Essay)
4.7/5 (36)
A higher rate of saving at the national level will,in the long-run ________.
(Multiple Choice)
4.7/5 (43)
Figure 6.1
-According to Figure 6.1,the period from 1974 to 1995 is particularly remarkable for the slow growth of ________.
(Multiple Choice)
4.7/5 (39)
Given the production function Y = A ![Given the production function Y = A and fixed values for the saving rate and depreciation,if productivity is growing at an average rate of three percent,and the labor input grows at two percent,there is a unique growth rate of capital that is sustainable.That is,if the growth rate of capital is either higher or lower than this steady-state value,then it must eventually change,even if nothing else in the economy changes.Calculate this steady-state growth rate of capital,and explain why it alone is a sustainable rate.[Hint: Use the fact that the growth rates of output and capital per worker are 43% higher than the growth rate of productivity.]](https://storage.examlex.com/TB5036/11ea69ca_6375_3f70_b0c5_19bb1192e869_TB5036_11.jpg)
![Given the production function Y = A and fixed values for the saving rate and depreciation,if productivity is growing at an average rate of three percent,and the labor input grows at two percent,there is a unique growth rate of capital that is sustainable.That is,if the growth rate of capital is either higher or lower than this steady-state value,then it must eventually change,even if nothing else in the economy changes.Calculate this steady-state growth rate of capital,and explain why it alone is a sustainable rate.[Hint: Use the fact that the growth rates of output and capital per worker are 43% higher than the growth rate of productivity.]](https://storage.examlex.com/TB5036/11ea69ca_6375_6681_b0c5_49ce065ab037_TB5036_11.jpg) and fixed values for the saving rate and depreciation,if productivity is growing at an average rate of three percent,and the labor input grows at two percent,there is a unique growth rate of capital that is sustainable.That is,if the growth rate of capital is either higher or lower than this steady-state value,then it must eventually change,even if nothing else in the economy changes.Calculate this steady-state growth rate of capital,and explain why it alone is a sustainable rate.[Hint: Use the fact that the growth rates of output and capital per worker are 43% higher than the growth rate of productivity.]
and fixed values for the saving rate and depreciation,if productivity is growing at an average rate of three percent,and the labor input grows at two percent,there is a unique growth rate of capital that is sustainable.That is,if the growth rate of capital is either higher or lower than this steady-state value,then it must eventually change,even if nothing else in the economy changes.Calculate this steady-state growth rate of capital,and explain why it alone is a sustainable rate.[Hint: Use the fact that the growth rates of output and capital per worker are 43% higher than the growth rate of productivity.]
(Essay)
4.9/5 (33)
Filters
- Essay(0)
- Multiple Choice(0)
- Short Answer(0)
- True False(0)
- Matching(0)