Exam 3: Basic Elements of Supply and Demand Part
Exam 1: The Central Concepts of Economics125 Questions
Exam 2: The Modern Mixed Economy80 Questions
Exam 3: Basic Elements of Supply and Demand Part85 Questions
Exam 4: Supply and Demand: Elasticity and Applications79 Questions
Exam 5: Demand and Consumer Behavior74 Questions
Exam 6: Production and Business Organization79 Questions
Exam 7: Analysis of Costs80 Questions
Exam 8: Analysis of Perfectly Competitive Markets80 Questions
Exam 9: Imperfect Competition and Monopoly80 Questions
Exam 10: Competition Among the Few80 Questions
Exam 11: Economics of Uncertainty 60 Questions
Exam 12: The Labor Market80 Questions
Exam 13: Land, Natural Resources, and the Environment80 Questions
Exam 14: Capital, Interest, and Profits Part Four: Applications of Economic Principles50 Questions
Exam 15: Government Taxation and Expenditure71 Questions
Exam 16: Efficiency Vsequality: The Big Trade-Off79 Questions
Exam 17: International Trade74 Questions
Exam 18: Overview of Macroeconomics80 Questions
Exam 19: Geometrical Analysis of Consumer Equilibrium40 Questions
Exam 20: Production Cost Theory and Decisions of the Firm30 Questions
Select questions type
Use the following to answer questions :
Figure 3-3 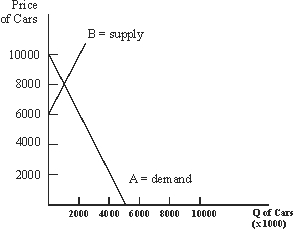 -Assume that automotive workers strike and the technological improvements occur at the same time.If initial market conditions were reflected by the structure of Figure 3-3, which of the following must occur?
Free
(Multiple Choice)
4.9/5  (33)
(33)
Correct Answer: Verified
E
Use the following to answer questions :
Table 3-1 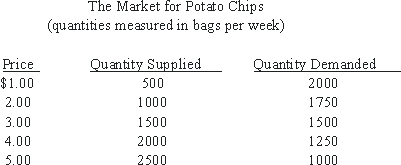 -According to Table 3-1, we can be fairly certain that:
Free
(Multiple Choice)
4.8/5 (37)
Correct Answer:Verified
B
In a standard supply-and-demand diagram, what happens when demand decreases?
Free
(Multiple Choice)
4.7/5 (32)
Correct Answer:Verified
D
Use the following to answer questions :
Figure 3-2 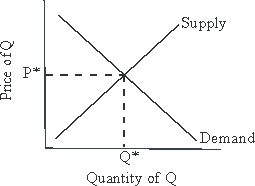 -Let P* and Q* represent market clearing price and quantity, respectively.Given the supply and demand curves drawn in Figure 3-2, a technological advance that makes the production of Q more efficient will cause:
(Multiple Choice)
4.9/5 (46)
Since the amount bought must equal amount sold, at no price can there be a lack of equality between the quantities demanded and supplied of a good.
(True/False)
4.9/5 (36)
The demand curve for a normal good will shift to the right if:
(Multiple Choice)
4.8/5 (40)
Use the following to answer questions :
Table 3-1
-According to Table 3-1, the equilibrium level of output is:
(Multiple Choice)
4.9/5 (40)
Use the following to answer questions :
Figure 3-5 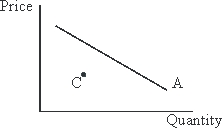 -According to the standard supply and demand apparatus, line A in Figure 3-5 should represent:
(Multiple Choice)
4.8/5 (38)
Assume that the demand for boats as shown in the figure below is P = $500 - 10Q, while the supply is P = $100 + 10Q.Market equilibrium would then be: 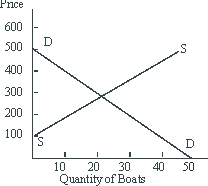
(Multiple Choice)
4.9/5 (39)
The high and rising price of lobsters is not necessarily indicative of monopoly in the lobster-fishing market.
(True/False)
4.9/5 (45)
Use the following to answer questions :
Figure 3-6 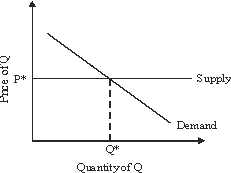 -Given the supply and demand curves drawn in Figure 3-6, an increase in the cost of an input can be expected to push the market clearing price up and the market clearing quantity down.
(True/False)
4.8/5 (28)
If E were the old equilibrium in the market for wheat in the figure below, and E' the new one, which of the following could have caused the change? 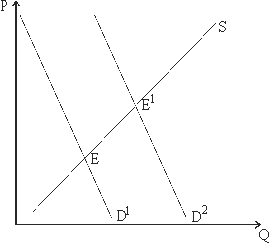
(Multiple Choice)
4.8/5 (42)
The law of downward-sloping demand states that there is an inverse relation between price and quantity demanded.
(True/False)
4.9/5 (44)
Four of the five events described below might reasonably be expected to shift the demand curve for beef to a new position.One would not shift that demand curve.The single exception is:
(Multiple Choice)
4.7/5 (42)
Any change in the price of an input can be expected to move equilibrium price up or down in the same direction along the market demand curve.(Everything else held fixed.)
(True/False)
4.8/5 (43)
When we say that a price in a competitive market is "too high to clear the market" we usually mean that (given upward-sloping supply curves):
(Multiple Choice)
5.0/5 (38)
An increase in the supply of commodity X for any given price of X could be caused by
(Multiple Choice)
4.8/5 (31)
Use the following to answer questions :
Figure 3-5
-Which of the following could represent the demand schedule in Figure 3-5?
(Multiple Choice)
4.8/5 (37)
Filters
- Essay(0)
- Multiple Choice(0)
- Short Answer(0)
- True False(0)
- Matching(0)