Exam 3: Basic Elements of Supply and Demand Part
Exam 1: The Central Concepts of Economics125 Questions
Exam 2: The Modern Mixed Economy80 Questions
Exam 3: Basic Elements of Supply and Demand Part85 Questions
Exam 4: Supply and Demand: Elasticity and Applications79 Questions
Exam 5: Demand and Consumer Behavior74 Questions
Exam 6: Production and Business Organization79 Questions
Exam 7: Analysis of Costs80 Questions
Exam 8: Analysis of Perfectly Competitive Markets80 Questions
Exam 9: Imperfect Competition and Monopoly80 Questions
Exam 10: Competition Among the Few80 Questions
Exam 11: Economics of Uncertainty 60 Questions
Exam 12: The Labor Market80 Questions
Exam 13: Land, Natural Resources, and the Environment80 Questions
Exam 14: Capital, Interest, and Profits Part Four: Applications of Economic Principles50 Questions
Exam 15: Government Taxation and Expenditure71 Questions
Exam 16: Efficiency Vsequality: The Big Trade-Off79 Questions
Exam 17: International Trade74 Questions
Exam 18: Overview of Macroeconomics80 Questions
Exam 19: Geometrical Analysis of Consumer Equilibrium40 Questions
Exam 20: Production Cost Theory and Decisions of the Firm30 Questions
Select questions type
Use the following to answer questions :
Figure 3-2 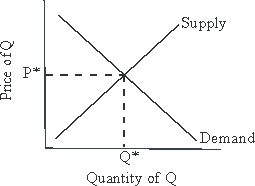 -Let P* and Q* represent market clearing price and quantity, respectively.Given the supply and demand curves drawn in Figure 3-2, a reduction in the price of an input used in the production of Q will cause:
(Multiple Choice)
4.8/5  (30)
(30)
Given a normal upward sloping supply schedule and a downward sloping demand schedule, an increase in labor productivity should result in a lower equilibrium price for the concerned good.
(True/False)
4.8/5 (40)
If supply decreases and family income increases, it is possible that the quantity demanded will remain the same.
(True/False)
4.8/5 (41)
Filters
- Essay(0)
- Multiple Choice(0)
- Short Answer(0)
- True False(0)
- Matching(0)