Exam 21: Cost Behavior and Decisions Using C-V-P Analysis
Exam 1: Accounting Information: Users and Uses47 Questions
Exam 2: Financial Statements: An Overview118 Questions
Exam 3: The Accounting Cycle: The Mechanics of Accounting109 Questions
Exam 4: Completing the Accounting Cycle112 Questions
Exam 5: Internal Controls: Ensuring the Integrity of Financial Information108 Questions
Exam 6: Receivables: Selling a Product or a Service115 Questions
Exam 7: Inventory and the Cost of Sales148 Questions
Exam 8: Completing the Operating Cycle93 Questions
Exam 9: Investments: Property, Plant, and Equipment and Intangible Assets130 Questions
Exam 10: Financing: Long-Term Liabilities113 Questions
Exam 11: Financing: Equity86 Questions
Exam 12: Investments: Debt and Equity Securities89 Questions
Exam 13: Statement of Cash Flows97 Questions
Exam 14: Analyzing Financial Statements91 Questions
Exam 15: Management Accounting and Cost Concepts104 Questions
Exam 16: Cost Flows and Business Organizations136 Questions
Exam 17: Activity-Based Costing64 Questions
Exam 18: Budgeting and Control128 Questions
Exam 19: Controlling Cost and Profit137 Questions
Exam 20: Inventory Management and Variable and Absorption Costing89 Questions
Exam 21: Cost Behavior and Decisions Using C-V-P Analysis152 Questions
Exam 22: Relevant Information and Decisions97 Questions
Exam 23: Capital Investment Decisions103 Questions
Exam 24: New Measures of Performance83 Questions
Select questions type
Costs that contain both fixed and variable components are:
(Multiple Choice)
4.9/5  (37)
(37)
What are the total costs for a company with per-unit variable costs of $12 and total fixed costs of $51,000 if it sells 8,000 units of product?
(Multiple Choice)
4.9/5 (30)
Which of the following types of firms would typically have the lowest level of operating leverage?
(Multiple Choice)
4.8/5 (39)
Exhibit 21-7 Use the cost-volume-profit graph below to answer the following question(s).
 -Refer to Exhibit 21-7. On the cost-volume-profit graph, the area between point G, the origin of the graph, and the point at which Line B crosses the sales axis represents the:
(Multiple Choice)
4.9/5 (29)
Johnston Co. sells three products with the following sales and variable cost rates:  Assume that Johnston's total fixed costs are $9,000. Using the current sales mix, what is Johnston's break-even point?
(Multiple Choice)
4.7/5 (32)
Exhibit 21-3 The following partial income statement is available for Lauria Company:
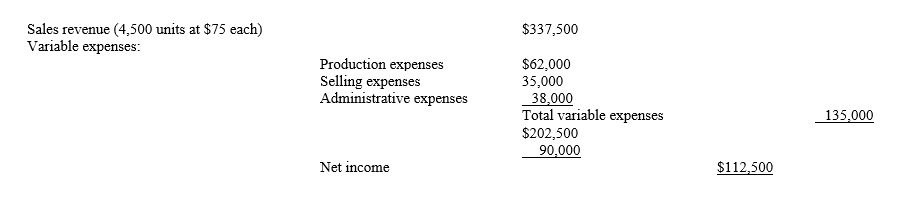 -Refer to Exhibit 21-3. Given the data above, at an activity level of 5,000 units, net income would increase by:
(Multiple Choice)
4.9/5 (37)
Collins Co. earned a profit of $2,000 in January. The company has estimated that sales will increase by $13,500 in February. Assume that fixed costs for January were $3,000 (and are not expected to change) and the variable cost ratio is 40%. What is the expected profit for the next month?
(Multiple Choice)
4.9/5 (39)
Assume that StoneWorks has total fixed costs of $31,540 for the period. Each unit sells for $20. The variable cost per unit is $12.40. How many units must be sold to break even?
(Multiple Choice)
4.8/5 (37)
During the past year, United Memories sold 150,000 units. Each of these units was sold at a price of $75. At the end of the year, the accounting department identified the costs per unit to be: $20 in materials, $15 for selling costs, and $8 for general expenses. Fixed costs for the year were $1,250,000. The president of United Memories wants to know what the contribution margin and net income were for the year.
(Essay)
4.8/5 (35)
Filters
- Essay(0)
- Multiple Choice(0)
- Short Answer(0)
- True False(0)
- Matching(0)