Exam 21: Cost Behavior and Decisions Using C-V-P Analysis
Exam 1: Accounting Information: Users and Uses47 Questions
Exam 2: Financial Statements: An Overview118 Questions
Exam 3: The Accounting Cycle: The Mechanics of Accounting109 Questions
Exam 4: Completing the Accounting Cycle112 Questions
Exam 5: Internal Controls: Ensuring the Integrity of Financial Information108 Questions
Exam 6: Receivables: Selling a Product or a Service115 Questions
Exam 7: Inventory and the Cost of Sales148 Questions
Exam 8: Completing the Operating Cycle93 Questions
Exam 9: Investments: Property, Plant, and Equipment and Intangible Assets130 Questions
Exam 10: Financing: Long-Term Liabilities113 Questions
Exam 11: Financing: Equity86 Questions
Exam 12: Investments: Debt and Equity Securities89 Questions
Exam 13: Statement of Cash Flows97 Questions
Exam 14: Analyzing Financial Statements91 Questions
Exam 15: Management Accounting and Cost Concepts104 Questions
Exam 16: Cost Flows and Business Organizations136 Questions
Exam 17: Activity-Based Costing64 Questions
Exam 18: Budgeting and Control128 Questions
Exam 19: Controlling Cost and Profit137 Questions
Exam 20: Inventory Management and Variable and Absorption Costing89 Questions
Exam 21: Cost Behavior and Decisions Using C-V-P Analysis152 Questions
Exam 22: Relevant Information and Decisions97 Questions
Exam 23: Capital Investment Decisions103 Questions
Exam 24: New Measures of Performance83 Questions
Select questions type
Exhibit 21-8 Use the profit graph below to answer the following question(s).
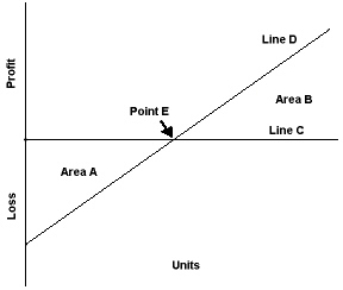 -Refer to Exhibit 21-8. Point E on the profit graph represents the:
(Multiple Choice)
4.8/5  (34)
(34)
If total sales are $460,000, total variable costs are $138,000, and total fixed costs are $184,000, the contribution margin is:
(Multiple Choice)
4.8/5 (43)
Refer to the figure below. A charge for electricity that is based on a flat rate plus a variable cost after a certain number of kilowatt-hours are used follows which of the following cost behavior patterns?
(Multiple Choice)
4.9/5 (30)
Exhibit 21-7 Use the cost-volume-profit graph below to answer the following question(s).
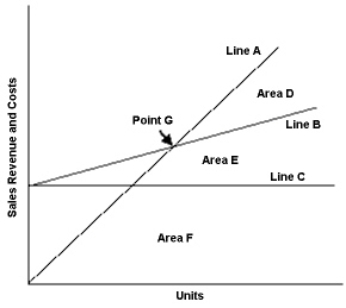 -Refer to Exhibit 21-7. Revenues are represented on the C-V-P graph by:
(Multiple Choice)
4.8/5 (38)
The following information is given for Kooskia Company:
 Compute the following items for Kooskia Company:

(Essay)
5.0/5 (34)
Winslow Company sold 10,000 swing sets this past year at $280 each. The company incurred expenses of $560,000 for rent, administrative salaries, and insurance for the building. The cost per unit for Winslow was $168. The CEO, Ms. Dunlop, wants to know what the contribution margin was for the year as a percent of sales, how much profit would be earned with an additional $340,000 in sales, and what the profit would be on an additional 4,000 units in sales.
(Essay)
4.9/5 (34)
Exhibit 21-7 Use the cost-volume-profit graph below to answer the following question(s).
 -Refer to Exhibit 21-7. Line C on the cost-volume-profit graph represents the:
(Multiple Choice)
4.9/5 (31)
Exhibit 21-7 Use the cost-volume-profit graph below to answer the following question(s).
 -Refer to Exhibit 21-7. Point G on the cost-volume-profit graph represents the:
(Multiple Choice)
4.9/5 (36)
Exhibit 21-9 Stella Signs sells two different products. Following are the monthly revenues and costs:
 - Refer to Exhibit 21-9. Determine the total contribution margin ratio at the current sales mix.
(Multiple Choice)
4.9/5 (33)
Grate Company's product has a selling price of $15 and a per-unit variable cost of $8. Its fixed costs are $14,000. How many units must the company sell to earn a profit of $35,000?
(Multiple Choice)
5.0/5 (45)
Mosely Company's per-unit cost is the same at all levels of activity. The company's cost structure must have all:
(Multiple Choice)
4.8/5 (36)
A company that has a per-unit contribution margin of $140 and fixed costs of $126,000 will break even when it sells:
(Multiple Choice)
4.7/5 (45)
The contribution margin minus total fixed costs is equal to:
(Multiple Choice)
4.7/5 (38)
Exhibit 21-1 Wimmer Company makes swimming suits and wants to analyze its mixed costs. The diagram below shows a scattergraph representing Wimmer's mixed costs for the previous five months.
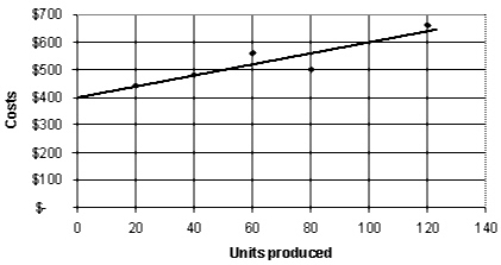 -Refer to Exhibit 21-1. Using the graph above, determine the amount of Wimmer's fixed costs.
(Multiple Choice)
4.9/5 (37)
At a break-even point of 600 units sold, the variable costs were $600 and the fixed costs were $300. What will the sale of each additional unit contribute to profit before income taxes?
(Multiple Choice)
5.0/5 (43)
Exhibit 21-5 The following is a partial income statement for Duncan Corporation for 2011:
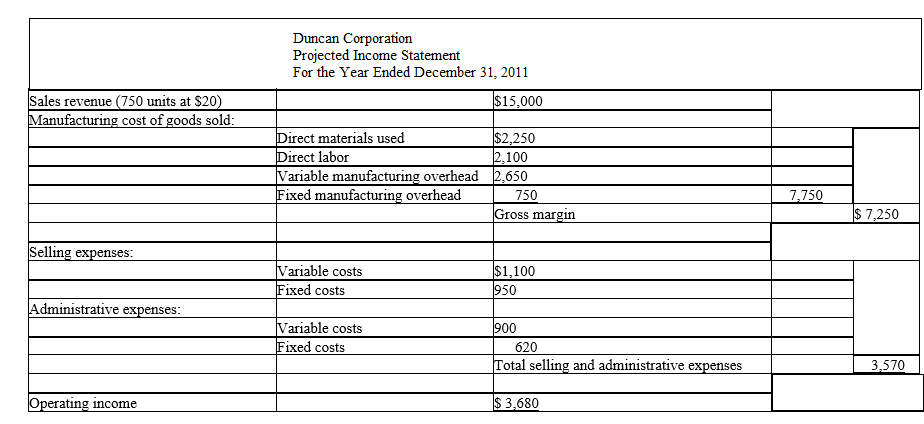 - Refer to Exhibit 21-5. How many units of its product will Duncan Corporation have to sell to break even?
(Multiple Choice)
4.8/5 (28)
If variable costs are $46 per unit, revenues are $76 per unit, and fixed costs are $7,500, the break-even point is:
(Multiple Choice)
4.8/5 (29)
Given the equation $500X = $300X + $200,000, the break-even point in units is:
(Multiple Choice)
4.8/5 (34)
Block Company sells three products, each with a different per-unit contribution margin. To compute Block Company's break-even point in units, it is necessary to know:
(Multiple Choice)
4.7/5 (35)
Filters
- Essay(0)
- Multiple Choice(0)
- Short Answer(0)
- True False(0)
- Matching(0)