Exam 4: Demand
Exam 1: Introduction43 Questions
Exam 2: Supply and Demand225 Questions
Exam 3: A Consumers Constrained Choice130 Questions
Exam 4: Demand123 Questions
Exam 5: Consumer Welfare and Policy Analysis73 Questions
Exam 6: Firms and Production112 Questions
Exam 7: Costs132 Questions
Exam 8: Competitive Firms and Markets112 Questions
Exam 9: Properties and Applications of the Competitive Model101 Questions
Exam 10: General Equilibrium and Economic Welfare109 Questions
Exam 11: Monopoly and Monopsony142 Questions
Exam 12: Pricing and Advertising91 Questions
Exam 13: Game Theory85 Questions
Exam 14: Oligopoly and Monopolistic Competition114 Questions
Exam 15: Factor Markets115 Questions
Exam 16: Uncertainty103 Questions
Exam 17: Property Rights, Externalities, Rivalry, and Exclusion105 Questions
Exam 18: Asymmetric Information85 Questions
Exam 19: Contracts and Moral Hazards79 Questions
Select questions type
An individual's demand curve for a good can be derived by measuring the quantities selected as
Free
(Multiple Choice)
4.7/5  (28)
(28)
Correct Answer: Verified
A
Suppose Joe earns $1,000 in year 1 and $0 in year 2.Any amount he saves will earn interest at a rate of 0%.Draw Joe's budget line.(Hint: He can either consume all $1000 this year or consume nothing this year and have $1,100 next year. )Assuming convex indifference curves,show that an increase in the rate of interest can cause Joe's savings to either increase or decrease.Explain in terms of income and substitution effect.
Free
(Essay)
4.8/5 (36)
Correct Answer:Verified
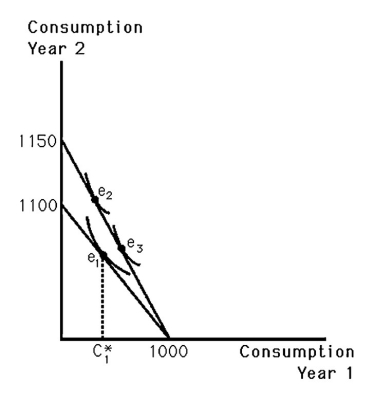
See the above figure.On the graph,his original bundle is  so that his savings equal 1000 - C1*.A higher interest rate rotates the budget line so that,depending on the shape of his indifference map,he may choose either e2,which means savings increase,or e3,which means savings decrease.One plus the interest rate represents the price of current consumption.A higher interest rate has two effects.The substitution effect means that Joe will save more because current consumption has become more expensive.The income effect says Joe will save less because,with the higher interest rate,lower savings could actually generate more future consumption.
If the price-consumption curve is upward sloping when the price of the good measured on the horizontal axis changes,then the demand curve for that good will be upward sloping.
Free
(True/False)
4.8/5 (32)
Correct Answer:Verified
False
A typical consumer spends 30% of income on housing and housing is a necessity for consumers (the income elasticity for housing is 0 < ξH < 1).What are the maximum and minimum values for the income elasticity of all other goods,ξO?
(Essay)
4.9/5 (32)
Jill consumes nothing but soup and cola.It is possible that both soup and cola are necessities for Jill.
(True/False)
4.9/5 (32)
Which graph in the above figure best represents a good that is an inferior good at some income levels,and a normal good at other income levels?
(Multiple Choice)
4.9/5 (36)
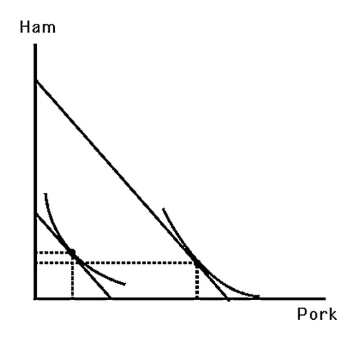 -The above figure shows Larry's indifference map and budget lines for ham and pork.Which of the following statements is TRUE?
(Multiple Choice)
4.8/5 (42)
Draw budget constraints,indifference curves,and the income consumption curve for a good that has an income elasticity that is perfectly inelastic.
(Essay)
4.7/5 (30)
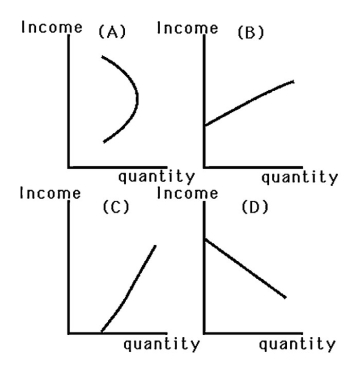 -When John's income was low,he could not afford to dine out and would respond to a pay raise by purchasing more frozen dinners.Now that his income is high,a pay raise causes him to dine out more often and buy fewer frozen dinners.Which graph in the above figure best represents John's Engel curve for frozen dinners?
(Multiple Choice)
4.9/5 (30)
Jerry spends his entire income on two goods,Bran and Tea.Every month he spends half of his income on each of these goods.Jerry's income elasticity of demand for Bran is -.75.What is the income elasticity of demand for Tea?
(Multiple Choice)
4.8/5 (46)
Why would you expect the demand for diamond jewelry to fall faster than plastic,costume jewelry when all incomes fall?
(Essay)
4.9/5 (21)
-The above figure shows Larry's indifference map and budget lines for ham and pork.Which of the following statements is TRUE?
(Multiple Choice)
4.7/5 (38)
Before an uneven rise in prices Allan consumed five bread and six juice.After the price increase and with an increased welfare payment from the government Allan consumes four bread and seven juice.Does the government payment represent a true cost-of-living adjustment?
(Multiple Choice)
4.9/5 (38)
Suppose hamburger is an inferior good,but not a Giffen good,for Bob.If the price of hamburgers increases,
(Multiple Choice)
4.8/5 (42)
Many manufacturers sell products labeled as having imperfections at a discount at their factory outlets but do not ship these imperfect goods to regular retail outlets.Why?
(Essay)
4.9/5 (37)
Dorothy lives in a city with high air pollution.Pollution is a bad,but she is able to avoid air pollution by wearing a face mask.Her preferences are given by
U(q1,q2)= (q1 - P)2q22
where q1 is the amount of time she spends wearing a mask,P is the amount of pollution and q2 is a composite of other goods (p2 = 1).Dorothy must decide how much to wear a mask and how much q2 to purchase.The price of masks is pM.Assume q1* > P when answering this question.
a.Derive Dorothy's demand for masks,q1*(p1,Y,P)
b.How does the quantity of pollution affect the demand for masks? That is,find q1*/P.
c.How does her income influence the quantity of masks she purchases? That is,find q1*/Y.
d.What condition must hold for the assumption q1* > P to hold?
(Essay)
4.9/5 (35)
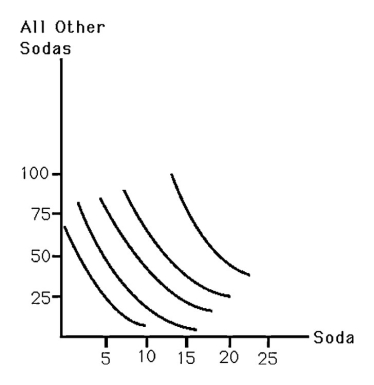 -The above figure shows a consumer's indifference curves for soda and all other goods.Assuming a budget of $100,derive the consumer's demand for soda for prices of $4 and $10 per case of soda.Estimate the price elasticity of demand for soda.
(Essay)
4.7/5 (43)
Suppose the quantity of x is measured on the horizontal axis.If the price consumption curve is vertical when the price of x changes,then the demand for x is
(Multiple Choice)
4.8/5 (35)
Filters
- Essay(0)
- Multiple Choice(0)
- Short Answer(0)
- True False(0)
- Matching(0)