Exam 24: The Influence of Monetary and Fiscal Policy on Aggregate Demand
Exam 1: Ten Principles of Economics348 Questions
Exam 2: Thinking Like an Economist530 Questions
Exam 3: Interdependence and the Gains From Trade426 Questions
Exam 4: The Market Forces of Supply and Demand567 Questions
Exam 5: Elasticity and Its Application502 Questions
Exam 6: Supply,demand,and Government Policies553 Questions
Exam 7: Consumers, producers, and the Efficiency of Markets455 Questions
Exam 8: Application: the Costs of Taxation421 Questions
Exam 9: Application: International Trade406 Questions
Exam 10: Externalities439 Questions
Exam 11: Public Goods and Common Resources348 Questions
Exam 12: The Costs of Production533 Questions
Exam 13: Firms in Competitive Markets479 Questions
Exam 14: Monopoly526 Questions
Exam 15: Measuring a Nations Income427 Questions
Exam 16: Measuring the Cost of Living433 Questions
Exam 17: Production and Growth417 Questions
Exam 18: Saving,investment,and the Financial System470 Questions
Exam 19: The Basic Tools of Finance421 Questions
Exam 20: Unemployment572 Questions
Exam 21: The Monetary System423 Questions
Exam 22: Money Growth and Inflation386 Questions
Exam 23: Aggregate Demand and Aggregate Supply471 Questions
Exam 24: The Influence of Monetary and Fiscal Policy on Aggregate Demand415 Questions
Select questions type
Figure 24-4.On the figure,MS represents money supply and MD represents money demand. 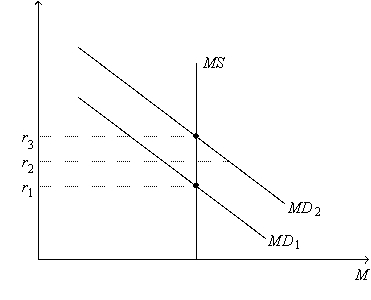 -Refer to Figure 24-4.Suppose the current equilibrium interest rate is r3.Let Y3 represent the corresponding quantity of goods and services demanded,and let P3 represent the corresponding price level.Starting from this situation,if the Federal Reserve decreases the money supply and if the price level remains at P3,then
(Multiple Choice)
4.8/5  (43)
(43)
If households view a tax cut as temporary,then the tax cut
(Multiple Choice)
4.8/5 (38)
If the inflation rate is zero,then the nominal and real interest rate are the same.
(True/False)
4.9/5 (40)
Unemployment insurance and welfare programs work as automatic stabilizers.
(True/False)
4.8/5 (32)
Assume the multiplier is 5 and that the crowding-out effect is $20 billion.An increase in government purchases of $10 billion will shift the aggregate-demand curve to the
(Multiple Choice)
4.8/5 (35)
Suppose the multiplier has a value that exceeds 1,and there are no crowding out or investment accelerator effects.Which of the following would shift aggregate demand to the right by more than the increase in expenditures?
(Multiple Choice)
5.0/5 (35)
According to the liquidity preference theory,an increase in the overall price level of 10 percent
(Multiple Choice)
4.8/5 (36)
According to liquidity preference theory,if there were a shortage of money,then
(Multiple Choice)
4.7/5 (25)
The multiplier for changes in government spending is calculated as
(Multiple Choice)
4.9/5 (45)
Figure 24-2.On the left-hand graph,MS represents the supply of money and MD represents the demand for money; on the right-hand graph,AD represents aggregate demand.The usual quantities are measured along the axes of both graphs.
 -Refer to Figure 24-2.Assume the money market is always in equilibrium.Under the assumptions of the model,
(Multiple Choice)
4.7/5 (41)
If the Fed conducts open-market purchases,the money supply
(Multiple Choice)
4.8/5 (36)
Assuming no crowding-out,investment-accelerator,or multiplier effects,a $100 billion increase in government expenditures shifts aggregate demand
(Multiple Choice)
4.9/5 (33)
If money demand shifted to the right and the Federal Reserve desired to return the interest rate to its original value,it could
(Multiple Choice)
4.8/5 (35)
Figure 24-2.On the left-hand graph,MS represents the supply of money and MD represents the demand for money; on the right-hand graph,AD represents aggregate demand.The usual quantities are measured along the axes of both graphs.
-Refer to Figure 24-2.As we move from one point to another along the money-demand curve MD1,
(Multiple Choice)
4.8/5 (42)
A policy that results in slow and steady growth of the money supply is an example of
(Multiple Choice)
4.8/5 (38)
Figure 24-4.On the figure,MS represents money supply and MD represents money demand.
-Refer to Figure 24-4.Suppose the current equilibrium interest rate is r1.Which of the following events would cause the equilibrium interest rate to increase?
(Multiple Choice)
4.9/5 (32)
If the Fed conducts open-market sales,which of the following quantities increase(s)?
(Multiple Choice)
4.8/5 (33)
If the multiplier is 6 and if there is no crowding-out effect,then a $60 billion increase in government expenditures causes aggregate demand to
(Multiple Choice)
4.8/5 (39)
Filters
- Essay(0)
- Multiple Choice(0)
- Short Answer(0)
- True False(0)
- Matching(0)