Exam 13: Multiple Regression
Exam 1: Overview of Statistics52 Questions
Exam 2: Data Collection111 Questions
Exam 3: Describing Data Visually108 Questions
Exam 4: Descriptive Statistics150 Questions
Exam 5: Probability123 Questions
Exam 6: Discrete Probability Distributions126 Questions
Exam 7: Continuous Probability Distributions120 Questions
Exam 8: Sampling Distributions and Estimation106 Questions
Exam 9: One-Sample Hypothesis Tests147 Questions
Exam 10: Two-Sample Hypothesis Tests113 Questions
Exam 11: Analysis of Variance126 Questions
Exam 12: Simple Regression135 Questions
Exam 13: Multiple Regression130 Questions
Exam 14: Time Series Analysis114 Questions
Exam 15: Chi-Square Tests99 Questions
Exam 16: Nonparametric Tests85 Questions
Exam 17: Quality Management108 Questions
Select questions type
A test is conducted in 22 cities to see if giving away free transit system maps will increase the number of bus riders. In a regression analysis, the dependent variable Y is the increase in bus riders (in thousands of persons) from the start of the test until its conclusion. The independent variables are X1 = the number (in thousands) of free maps distributed and a binary variable X2 = 1 if the city has free downtown parking, 0 otherwise. The estimated regression equation is . In city 3, the observed Y value is 7.3, X1 = 140, and X2 = 0. The residual for city 3 (in thousands) is:
(Multiple Choice)
4.7/5  (36)
(36)
Refer to the following regression results. The dependent variable is Abort (the number of abortions per 1000 women of childbearing age). The regression was estimated using data for the 50 U.S. states with these predictors: EdSpend = public K-12 school expenditure per capita, Age = median age of population, Unmar = percent of total births by unmarried women, Infmor = infant mortality rate in deaths per 1000 live births. Variable Coefficients Standard Error t- Stat Intercept -19.244 25.387 -0.758 EdSpend 0.0080040 0.0054472 1.469 Age 0.76012 0.66914 1.136 Unmar 0.98629 0.22132 4.456 InfMor -3.7848 1.0173 -3.720 Which statement is not supported by a two-tailed test?
(Multiple Choice)
4.8/5 (39)
Which is a characteristic of the variance inflation factor (VIF)?
(Multiple Choice)
4.7/5 (35)
When autocorrelation is present, the estimates of the coefficients will be unbiased.
(True/False)
4.7/5 (37)
Which of the following would be most useful in checking the normality assumption of the errors in a regression model?
(Multiple Choice)
4.8/5 (35)
In a multiple regression with 3 predictors in a sample of 25 U.S. cities, we would use F3,21 in a test of overall significance.
(True/False)
4.8/5 (36)
Which statement best describes this regression (Y = highway miles per gallon in 91 cars)? 0.499 Adjusted 0.444 91 0.707 9 Std. Error 4.019 Dep. Var. HwyMPG Source SS df MS F p -value Regression 1,305.7251 9 145.0806 8.98 .0000 Residual 1,308.3848 81 16.1529 Total 2,614.1099 90
(Multiple Choice)
4.9/5 (30)
Which is not a name often given to an independent variable that takes on just two values (0 or 1) according to whether or not a given characteristic is absent or present?
(Multiple Choice)
4.8/5 (32)
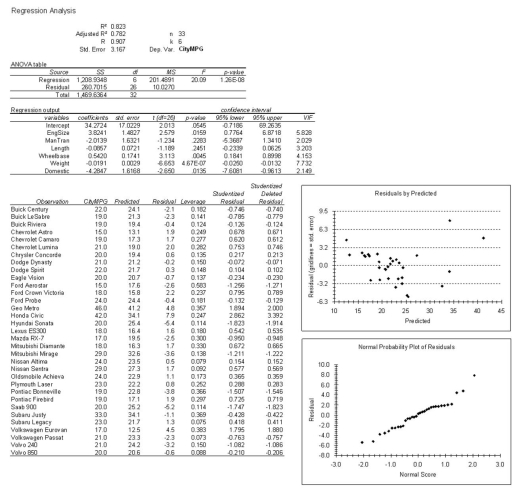
Analyze the regression results below (n = 33 cars in 1993) using the concepts you have learned about multiple regression. Circle things of interest and write comments in the margin. Make a prediction for CityMPG for a car with EngSize = 2.5, ManTran = 1, Length = 184, Wheelbase = 104, Weight = 3000, and Domestic = 0 (show your work). The variables are CityMPG = city MPG (miles per gallon by EPA rating); EngSize = engine size (liters); ManTran = 1 if manual transmission available, 0 otherwise; Length = vehicle length (inches); Wheelbase = vehicle wheelbase (inches); Weight = vehicle weight (pounds); Domestic = 1 if U.S. manufacturer, 0 otherwise.
(Essay)
4.8/5 (31)
Confidence intervals for Y may be unreliable when the residuals are not normally distributed.
(True/False)
4.9/5 (33)
Which is not a correct way to find the coefficient of determination?
(Multiple Choice)
4.8/5 (32)
A parsimonious model is one with many weak predictors but a few strong ones.
(True/False)
4.8/5 (30)
Non-normality of residuals is not usually considered a major problem unless there are outliers.
(True/False)
4.9/5 (33)
Autocorrelation of the residuals may affect the reliability of the t-values for the estimated coefficients of the predictors X1, X2,…, Xk.
(True/False)
4.8/5 (39)
The effect of a binary predictor is to shift the regression intercept.
(True/False)
4.9/5 (37)
Heteroscedasticity exists when all the errors (residuals) have the same variance.
(True/False)
4.7/5 (30)
Part of a regression output is provided below. Some of the information has been omitted. Source of variation SS df MS F Regression 3177.17 2 1588.6 Residual 17 17.717 Total 3478.36 19 The approximate value of F is:
(Multiple Choice)
4.8/5 (32)
In a regression model of student grades, we would code the nine categories of business courses taken (ACC, FIN, ECN, MGT, MKT, MIS, ORG, POM, QMM) by including nine binary (0 or 1) predictors in the regression.
(True/False)
4.7/5 (32)
Non-normality of the residuals from a regression can best be detected by looking at the residual plots against the fitted Y values.
(True/False)
4.8/5 (36)
Filters
- Essay(0)
- Multiple Choice(0)
- Short Answer(0)
- True False(0)
- Matching(0)