Exam 10: Two-Sample Hypothesis Tests
Exam 1: Overview of Statistics52 Questions
Exam 2: Data Collection111 Questions
Exam 3: Describing Data Visually108 Questions
Exam 4: Descriptive Statistics150 Questions
Exam 5: Probability123 Questions
Exam 6: Discrete Probability Distributions126 Questions
Exam 7: Continuous Probability Distributions120 Questions
Exam 8: Sampling Distributions and Estimation106 Questions
Exam 9: One-Sample Hypothesis Tests147 Questions
Exam 10: Two-Sample Hypothesis Tests113 Questions
Exam 11: Analysis of Variance126 Questions
Exam 12: Simple Regression135 Questions
Exam 13: Multiple Regression130 Questions
Exam 14: Time Series Analysis114 Questions
Exam 15: Chi-Square Tests99 Questions
Exam 16: Nonparametric Tests85 Questions
Exam 17: Quality Management108 Questions
Select questions type
The difference between two sample proportions p1 - p2 may be assumed normally distributed if each sample has at least 10 "successes" and 10 "failures."
(True/False)
4.7/5  (30)
(30)
In conducting a paired t-test of the difference between two population means, the usual null hypothesis is that the mean of the population of paired differences is zero.
(True/False)
4.9/5 (38)
Two well-known aviation training schools are being compared using random samples of their graduates. It is found that 70 of 140 graduates of Fly-More Academy passed their FAA exams on the first try, compared with 104 of 260 graduates of Blue Yonder Institute. The test statistic to test the pass rates for equality is:
(Multiple Choice)
4.7/5 (27)
The t-test for two samples of paired data will use n differences, making it a one-sample t-test.
(True/False)
4.9/5 (37)
The table below compares two samples taken to compare the mean age of individuals who purchased the iPhone 3G at two AT&T store locations. Very briefly, what conclusions can you draw?
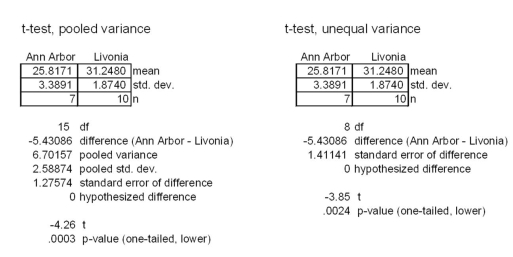
(Essay)
4.8/5 (32)
Which of the following is not a characteristic of the F distribution?
(Multiple Choice)
4.7/5 (33)
Random samples of students were compared to see whether or not there was a difference in the proportion favoring the university's proposed switch from MWF (three-day) classes to MW and TR (two-day) classes. The results shown below are from MegaStat. Analyze these results thoroughly.
Hypothesis test for two independent proportions
Residents Commuters 0.400 0.600 0.500 (as decimal) 80/200 120/200 200/400 (as fraction) 80. 120. 200 200 200 400
difference
hypothesized difference
std. error
z
p-value (two-tailed)
(Essay)
4.8/5 (31)
A medical researcher compared the variances in birth weights for five randomly chosen babies of each gender, with the MegaStat results shown below. F-test for equality of variance
variance: Boys
variance: Girls
F
p-value The population variances:
(Multiple Choice)
4.8/5 (40)
A psychology researcher has a theory that predicts women will tend to carry more cash than men. A random sample of Ersatz University students revealed that 16 females had a mean of $22.30 in their wallets with a standard deviation of $3.20, while 16 males had a mean of $17.30 with a standard deviation of $9.60. The test statistic for the researcher's hypothesis is:
(Multiple Choice)
4.9/5 (42)
John wants to compare two means. His sample statistics were and . Assuming equal variances, the pooled variance is:
(Multiple Choice)
4.9/5 (32)
The table below shows the mean number of daily errors by air traffic controller trainees during the first two weeks on the job. We want to perform a paired t-test at ? = .05 to see if the mean daily errors decreased significantly.
T1 T2 T3 T4 T5 T6 T7 Week 1 5.1 3 12.1 6.2 11.5 7.8 2.2 Week 2 3.2 2.2 8.7 7.7 9.4 7.8 3.1 What would be the degrees of freedom for the appropriate test?
(Multiple Choice)
4.9/5 (35)
Carver Memorial Hospital's surgeons have a new procedure that they think will decrease the time to perform an appendectomy. A sample of 8 appendectomies using the old method had a mean of 38 minutes with a variance of 36 minutes, while a sample of 10 appendectomies using the experimental method had a mean of 29 minutes with a variance of 16 minutes. For a right-tailed test of means (assume equal variances), the test statistic is:
(Multiple Choice)
4.8/5 (40)
When the variances are unknown, a test comparing two independent sample means would use the Student's t distribution.
(True/False)
4.9/5 (34)
Management of Melodic Kortholt Company compared absenteeism rates in two plants on the third Monday in November. Of Plant A's 800 employees, 120 were absent. Of Plant B's 1200 employees, 144 were absent. To compare the two proportions, the pooled proportion is:
(Multiple Choice)
4.8/5 (49)
Nacirema Airlines is buying a fleet of new fuel-efficient planes. The HogJet and the LitheJet both meet their price and performance needs, and both planes meet EPA noise guidelines. However, the quieter plane is preferred. Each plane is flown through a typical takeoff and landing sequence 10 times, while remote sensors at ground level record the noise levels (in decibels). The table below summarizes the sound level tests using Excel's default level of significance (? = 0.05).
takeJet HogJet Mean 80.3368 82.4669 Variance 0.7178 4.7385 Observations 10 10 Pooled Variance 2.7282 Hypothesized Diff 0.0000 df 18 t Stat -2.8837 P(T eat) one-tail 0.0049 t Critical one-tail 1.7341 P(T =-t) two-tail 0.0099 t Critical two-tail 2.1009 takeJet HogJet Mean 80.3368 82.4669 Variance 0.7178 4.7386 Observations 10 10 Hypothesized Diff 0 df 12 t Stat -2.8837 P(T ett ) one-tail 0.0069 t Critical one-tail 1.7823 (<=) two-tail 0.0137 Critical two-tail 2.1788
If we switched from ? = .05 to ? = .005 in a two-tailed test of means, our assumption about variances (assumed equal or assumed unequal) would:
(Multiple Choice)
4.8/5 (35)
A corporate analyst is testing whether mean inventory turnover has increased. Inventory turnover in six randomly chosen product distribution centers (PDCs) is shown. This Year Last Year PDC 1 5.1 4.1 PDC 2 3.9 2.9 PDC 3 4.8 2.8 PDC 4 3.4 3.4 PDC 5 4.6 2.6 PDC 6 7.7 4.7 The value of the test statistic is:
(Multiple Choice)
4.7/5 (37)
In an F test for the ratio of two population variances, the degrees of freedom in both the numerator and the denominator must be equal.
(True/False)
4.8/5 (38)
A new policy of "flex hours" is proposed. Random sampling showed that 28 of 50 female workers favored the change, while 22 of 50 male workers favored the change. Management wonders if there is a difference between the two groups. What is the p-value for a two-tailed test?
(Multiple Choice)
4.8/5 (41)
Filters
- Essay(0)
- Multiple Choice(0)
- Short Answer(0)
- True False(0)
- Matching(0)