Exam 14: Simple Linear Regression Analysis
Exam 11: Statistical Inferences for Population Variances43 Questions
Exam 12: Experimental Design and Analysis of Variance114 Questions
Exam 13: Chi-Square Tests120 Questions
Exam 14: Simple Linear Regression Analysis147 Questions
Exam 15: Multiple Regression and Model Building154 Questions
Exam 16: Time Series Forecasting and Index Numbers157 Questions
Exam 17: Process Improvement Using Control Charts115 Questions
Exam 18: Nonparametric Methods99 Questions
Exam 19: Decision Theory90 Questions
Select questions type
The dependent variable is the variable that is being described,predicted,or controlled.
Free
(True/False)
5.0/5  (29)
(29)
Correct Answer: Verified
True
Consider the following partial computer output from a simple linear regression analysis.
Free
(Essay)
4.8/5 (35)
Correct Answer:Verified
Analysis of Variance
What is the estimated slope?
b1 = -0.347
Regression Analysis
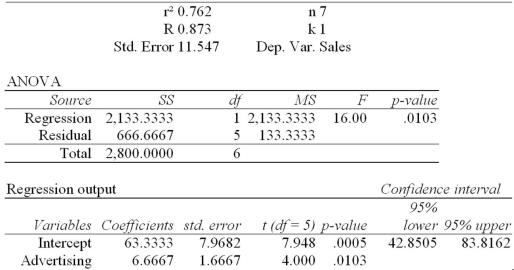 The local grocery store wants to predict its daily sales in dollars.The manager believes that the amount of newspaper advertising significantly affects the store's sales.He randomly selects 7 days of data consisting of daily grocery store sales (in thousands of dollars)and advertising expenditures (in thousands of dollars).The Excel/MegaStat output given above summarizes the results of the regression model.
At a significance level of .05,test the significance of the slope and state your conclusion.
The local grocery store wants to predict its daily sales in dollars.The manager believes that the amount of newspaper advertising significantly affects the store's sales.He randomly selects 7 days of data consisting of daily grocery store sales (in thousands of dollars)and advertising expenditures (in thousands of dollars).The Excel/MegaStat output given above summarizes the results of the regression model.
At a significance level of .05,test the significance of the slope and state your conclusion.
Free
(Essay)
4.8/5 (32)
Correct Answer:Verified
We reject H0,because tb1 = 4.00 and p-value = .0103 < .05.Thus,we conclude that there is sufficient evidence that dollars spent on advertising is a useful linear predictor of the grocery store sales.
A data set with 7 observations yielded the following.Use the simple linear regression model.
(Essay)
4.9/5 (37)
In simple regression analysis,the quantity that gives the amount by which Y (dependent variable)changes for a unit change in X (independent variable)is called the:
(Multiple Choice)
4.8/5 (33)
After plotting the data points on a scatter diagram,we have observed an inverse relationship between the independent variable (X)and the dependent variable (Y).Therefore,we can expect both the sample ___________ and the sample _____________ to be negative values.
(Multiple Choice)
4.9/5 (36)
Regression Analysis
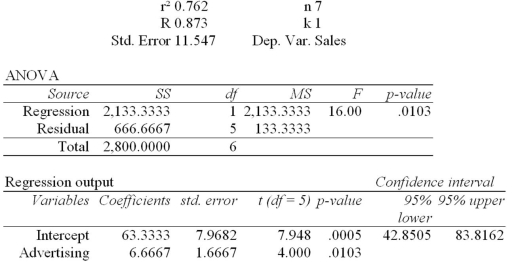 The local grocery store wants to predict its daily sales in dollars.The manager believes that the amount of newspaper advertising significantly affects the store's sales.He randomly selects 7 days of data consisting of daily grocery store sales (in thousands of dollars)and advertising expenditures (in thousands of dollars).The Excel/MegaStat output given above summarizes the results of the regression model.
What are the limits of the 99 percent prediction interval of the daily sales in dollars of an individual grocery store that has spent $3000 on advertising expenditures?
The local grocery store wants to predict its daily sales in dollars.The manager believes that the amount of newspaper advertising significantly affects the store's sales.He randomly selects 7 days of data consisting of daily grocery store sales (in thousands of dollars)and advertising expenditures (in thousands of dollars).The Excel/MegaStat output given above summarizes the results of the regression model.
What are the limits of the 99 percent prediction interval of the daily sales in dollars of an individual grocery store that has spent $3000 on advertising expenditures?
(Essay)
4.8/5 (34)
The estimated simple linear regression equation minimizes the sum of the squared deviations between each value of Y and the line.
(True/False)
4.8/5 (38)
Consider the following partial computer output from a simple linear regression analysis.
(Essay)
4.7/5 (41)
A data set with 7 observations yielded the following.Use the simple linear regression model.
(Essay)
4.7/5 (29)
Consider the following partial computer output from a simple linear regression analysis.
(Essay)
4.9/5 (32)
The range for r2 is between 0 and 1,and the range for r is between ____________.
(Multiple Choice)
5.0/5 (41)
If the Durbin-Watson statistic is less than dL,then we conclude that:
(Multiple Choice)
4.8/5 (32)
The _____ distribution is used for testing the significance of the slope term.
(Multiple Choice)
4.9/5 (39)
An experiment was performed on a certain metal to determine if the strength is a function of heating time.The sample size consists of 10 metal sheets.The simple linear regression equation is
(Essay)
4.9/5 (40)
The least squares point estimates of the simple linear regression model minimize the ____________.
(Multiple Choice)
4.8/5 (28)
In simple regression analysis,r2 is a percentage measure and measures the proportion of the variation explained by the simple linear regression model.
(True/False)
4.8/5 (26)
Consider the following partial computer output from a simple linear regression analysis.
(Essay)
4.9/5 (33)
The following results were obtained from a simple regression analysis:
Ŷ = 37.2895 - 1.2024X
r2 = .6744 sb = .2934
When X (independent variable)is equal to zero,what is the estimated value of Y (dependent variable)?
(Essay)
4.8/5 (37)
In simple linear regression analysis,we assume that the variance of the independent variable (X)is equal to the variance of the dependent variable (Y).
(True/False)
4.9/5 (33)
Filters
- Essay(0)
- Multiple Choice(0)
- Short Answer(0)
- True False(0)
- Matching(0)