Exam 1: Limits, Alternatives, and Choices
Exam 1: Limits, Alternatives, and Choices398 Questions
Exam 2: The Market System and the Circular Flow252 Questions
Exam 3: Demand, Supply, and Market Equilibrium339 Questions
Exam 4: Market Failures: Public Goods and Externalities235 Questions
Exam 5: Governments Role and Government Failure275 Questions
Exam 6: Elasticity255 Questions
Exam 7: Utility Maximization256 Questions
Exam 8: Behavioral Economics274 Questions
Exam 9: Businesses and the Costs of Production307 Questions
Exam 10: Pure Competition in the Short Run167 Questions
Exam 11: Pure Competition in the Long Run182 Questions
Exam 12: Pure Monopoly224 Questions
Exam 13: Monopolistic Competition194 Questions
Exam 14: Oligopoly and Strategic Behavior265 Questions
Exam 15: Technology, Rd, and Efficiency231 Questions
Exam 16: The Demand for Resources244 Questions
Exam 17: Wage Determination308 Questions
Exam 18: Rent, Interest, and Profit210 Questions
Exam 19: Natural Resource and Energy Economics290 Questions
Exam 20: Public Finance: Expenditures and Taxes232 Questions
Exam 21: Antitrust Policy and Regulation237 Questions
Exam 22: Agriculture: Economics and Policy217 Questions
Exam 23: Income Inequality, Poverty, and Discrimination272 Questions
Exam 24: Health Care240 Questions
Exam 25: Immigration197 Questions
Exam 26: International Trade241 Questions
Exam 27: The Balance of Payments, Exchange Rates, and Trade Deficits252 Questions
Exam 28: The Economics of Developing Countries249 Questions
Select questions type
The basic difference between consumer goods and capital goods is that
(Multiple Choice)
4.9/5  (34)
(34)
The production possibilities curve shows various combinations of two products that an economy can produce when achieving full employment.
(True/False)
4.8/5 (27)
Assume that a consumer has a given budget or income of $12 and that she can buy only two goods, apples or bananas. The price of an apple is $1.50 and the price of a banana is $0.75. For this consumer, the opportunity cost of buying one more apple is
(Multiple Choice)
4.8/5 (39)
Which of the following exemplifies a microeconomic question?
(Multiple Choice)
4.9/5 (31)
Suppose that a consumer purchases just two goods, X and Y. The Y-intercept of the budget line in this case would indicate the
(Multiple Choice)
4.8/5 (35)
Which of the following indicates an inverse relationship between x and y?
(Multiple Choice)
4.7/5 (35)
When an economy is operating under conditions of full employment, the production of more of commodity A will mean the production of less of commodity B because
(Multiple Choice)
4.7/5 (43)
A person should consume more of something when its marginal
(Multiple Choice)
4.9/5 (36)
If two sets of data are inversely related, they will appear on a graph as an upward-sloping line.
(True/False)
4.8/5 (36)
Answer the question on the basis of the following five data sets, wherein it is assumed that the variable shown on the left is the independent variable and the one on the right is the dependent variable. Assume in graphing these data that the independent variable is shown on the horizontal axis and the dependent variable on the vertical axis.  Refer to the data sets. For which data set(s) is the vertical intercept zero?
(Multiple Choice)
4.9/5 (38)
Rational behavior implies that different people faced with similar choices will make the same decisions.
(True/False)
5.0/5 (35)
Imagine an ideal scenario where world peace prevails and all nations are led by peace-minded leaders. In such a world, the
(Multiple Choice)
4.8/5 (38)
When studying human behavior, economists assume rational self-interest. This means that
(Multiple Choice)
4.8/5 (33)
A point or product-combination to the left of (or inside) a budget line
(Multiple Choice)
4.8/5 (42)
The following graph is the production possibilities curve of a nation. 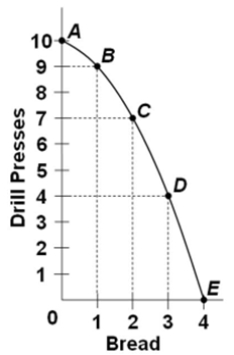 The total opportunity cost of nine drill presses is
(Multiple Choice)
4.9/5 (33)
Filters
- Essay(0)
- Multiple Choice(0)
- Short Answer(0)
- True False(0)
- Matching(0)