Exam 14: Financial Performance Measurement
Exam 1: Uses of Accounting Information and the Financial Statements181 Questions
Exam 2: Analyzing Business Transactions204 Questions
Exam 3: Measuring Business Income235 Questions
Exam 4: Supplement - Closing Entries and the Work Sheet62 Questions
Exam 5: Financial Reporting and Analysis168 Questions
Exam 6: The Operating Cycle and Merchandising Operations199 Questions
Exam 7: Inventories168 Questions
Exam 8: Cash and Receivables188 Questions
Exam 9: Current Liabilities and Fair Value Accounting197 Questions
Exam 10: Long Term Assets238 Questions
Exam 11: Long-Term Liabilities197 Questions
Exam 12: Stockholders Equity237 Questions
Exam 13: The Statement of Cash Flows163 Questions
Exam 14: Financial Performance Measurement198 Questions
Exam 15: Investments173 Questions
Select questions type
A balance sheet that displays only component percentages is called a
(Multiple Choice)
4.9/5  (42)
(42)
Use the following information to calculate the ratios requested below.Round answers to one decimal place.Show your work.


(Essay)
4.8/5 (37)
In trend analysis,each item is expressed as a percentage of the
(Multiple Choice)
4.9/5 (36)
The number of days' sales uncollected is determined by dividing
(Multiple Choice)
4.7/5 (36)
Financial statement analysis can be both past- and future-oriented.
(True/False)
4.7/5 (34)
Match each definition with the correct term below.
-Quick ratio
(Multiple Choice)
4.8/5 (35)
The following selected amounts were extracted from the financial statements of Bandera Corporation.
 Prepare a trend analysis for net sales,cost of goods sold,and gross margin.(Round answers to the nearest tenth of 1 percent.)Use Year 1 as the base year.

(Essay)
4.7/5 (43)
What is horizontal analysis,and why is it useful in performing financial performance measurement?
(Essay)
4.8/5 (44)
Which of the following best describes the debt to equity ratio?
(Multiple Choice)
4.9/5 (36)
Companies file their quarterly reports with the SEC on Form 8K.
(True/False)
4.8/5 (32)
Lois Kent has owned and managed the operations of a small chain of sporting goods stores for the past two years.She has asked her administrative assistant to provide her with some annual reports of other companies that sell sporting goods as well as some published reports showing norms for the sporting goods industry so that Lois can compare the financial ratios of her company with those of other companies that sell sporting goods.Discuss the limitations of using comparisons with other companies and industry norms,which Lois needs to remember.
(Essay)
4.8/5 (38)
The following information pertains to Jasmin Corporation.Assume that all balance sheet amounts represent both average and ending figures. 
 Jasmin Corporation had 6,000 shares of common stock issued and outstanding.The market price of Jasmin common stock on December 31,2013,was $20.Jasmin paid dividends of $0.90 per share during 2013.
What is the debt to equity ratio for this corporation?
Jasmin Corporation had 6,000 shares of common stock issued and outstanding.The market price of Jasmin common stock on December 31,2013,was $20.Jasmin paid dividends of $0.90 per share during 2013.
What is the debt to equity ratio for this corporation?
(Multiple Choice)
4.9/5 (34)
Prepare a trend analysis of the following data using 2011 as the base year.Place your answers in the chart provided.Comment on the trend.


(Essay)
4.8/5 (35)
Following are the financial statements for Starman Corporation for the year ended December 31,2013.Assume that all balance sheet amounts represent both average and ending figures. 
 What is the receivable turnover for this corporation?
(Multiple Choice)
4.8/5 (39)
Contrast the circumstances where horizontal analysis would be an effective analysis tool with those where common-sized analysis would be more useful.
(Essay)
4.9/5 (39)
The following selected amounts were extracted from the financial statements of Clay Corporation. (Round all answers below to one decimal place.)
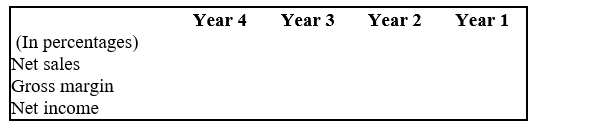
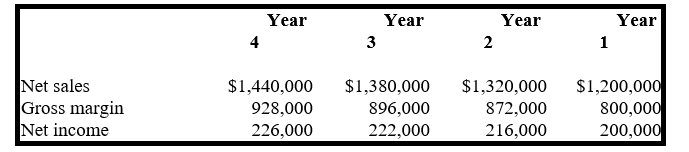 a. Prepare a trend analysis for net sales, gross margin, and net income using Year 1 as the base year.
 b. For net sales, gross margin, and net income:
1. Calculate the percentage change from Year 1 to Year 2.
2. Calculate the percentage change from Year 2 to Year 3.
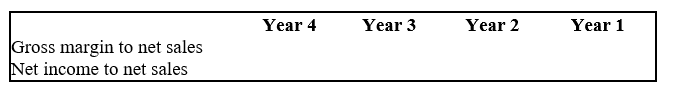
c. For each of the four years, compute the percentage relationship of gross margin to net sales and the relationship of net income to net sales.
b. For net sales, gross margin, and net income:
1. Calculate the percentage change from Year 1 to Year 2.
2. Calculate the percentage change from Year 2 to Year 3.
c. For each of the four years, compute the percentage relationship of gross margin to net sales and the relationship of net income to net sales.
 d. Identify which requirement(s) above involve(s):
1. Horizontal analysis
2. Vertical analysis
Round all answers to the nearest tenth of 1 percent.
d. Identify which requirement(s) above involve(s):
1. Horizontal analysis
2. Vertical analysis
Round all answers to the nearest tenth of 1 percent.
(Essay)
4.9/5 (41)
Filters
- Essay(0)
- Multiple Choice(0)
- Short Answer(0)
- True False(0)
- Matching(0)