Exam 2: Resource Utilization
Exam 1: A Brief Economic History of the United States263 Questions
Exam 2: Resource Utilization267 Questions
Exam 3: The Mixed Economy262 Questions
Exam 4: Supply and Demand256 Questions
Exam 5: Demand, Supply, and Equilibrium227 Questions
Exam 6: The Price Elasticities of Demand and Supply239 Questions
Exam 7: Theory of Consumer Behavior133 Questions
Exam 8: Cost242 Questions
Exam 9: Profit, Loss, and Perfect Competition365 Questions
Exam 10: Monopoly234 Questions
Exam 11: Monopolistic Competition164 Questions
Exam 12: Oligopoly186 Questions
Exam 13: Corporate Mergers and Antitrust137 Questions
Exam 14: Demand in the Factor Market197 Questions
Exam 15: Labor Unions202 Questions
Exam 16: Labor Markets and Wage Rates157 Questions
Exam 17: Rent, Interest, and Profit189 Questions
Exam 18: Income Distribution and Poverty285 Questions
Exam 19: International Trade269 Questions
Exam 20: International Finance230 Questions
Select questions type
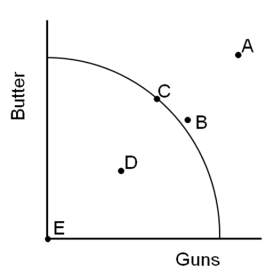 -Which point shows where our economy was temporarily operating during World War II, when we had reduced our unemployment rate to about two percent?
(Multiple Choice)
4.9/5  (41)
(41)
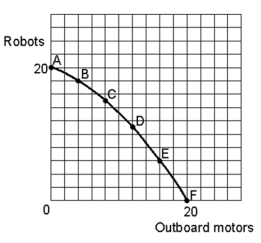 -The economy could produce at 8 units of outboard motors and 18 units of robots
(Multiple Choice)
4.9/5 (34)
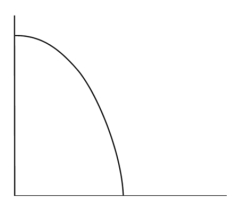 -Place point Q on the graph to indicate an unemployment rate of 100 percent, point R to indicate full employment and point S to indicate where our economy usually operates.
(Essay)
4.8/5 (36)
According to the law of increasing costs, as a textile company spends more money to eliminate dust particles from the workplace to increase worker safety
(Multiple Choice)
5.0/5 (34)
 -Referring to a production possibilities curve and the goods being compared, depict the economic event. Assuming the United States was producing at full employment levels in the late 1980s, peace breaks out as the Cold War ends (guns vs. butter).
(Multiple Choice)
4.8/5 (33)
If our economy is operating at peak efficiency, it is on its __________________________.
(Short Answer)
5.0/5 (32)
-Referring to a production possibilities curve and the goods being compared, depict the economic event. The bubonic plague (Black Death) in the 1300s killed one-third of Europe's population (capital goods vs. consumer goods).
(Multiple Choice)
4.8/5 (32)
If our unemployment rate is 10 percent and our capacity utilization rate is 70 percent, our economy is in the midst of a ___________.
(Short Answer)
4.8/5 (36)
Economic growth can be shown by ____________________ production possibilities curve.
(Multiple Choice)
5.0/5 (42)
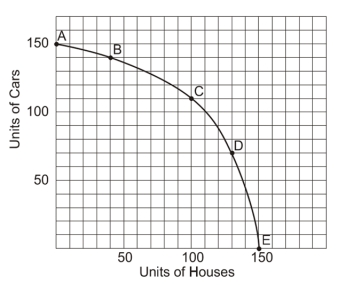 -What is the opportunity cost of going from point D to point C?
(Short Answer)
4.9/5 (38)
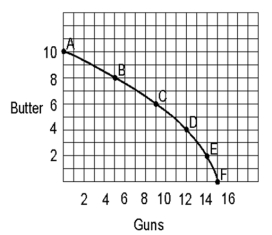 -If the country wanted to produce the maximum total number of units of guns and butter combined, it would produce at point(s) _______________.
(Short Answer)
4.9/5 (30)
The United States was able to produce temporarily outside its production possibilities curve for several years during World War II by doing which of the following?
(Multiple Choice)
4.8/5 (43)
Filters
- Essay(0)
- Multiple Choice(0)
- Short Answer(0)
- True False(0)
- Matching(0)