Exam 3: Measuring Macroeconomic Performance: Wages, Employment and the Labour Market
Exam 1: Measuring Macroeconomic Performance: Output and Prices202 Questions
Exam 2: Measuring Macroeconomic Performance: Saving and Wealth139 Questions
Exam 3: Measuring Macroeconomic Performance: Wages, Employment and the Labour Market176 Questions
Exam 4: Short-Term Economic Fluctuations131 Questions
Exam 5: Spending and Output in the Short Run207 Questions
Exam 6: Fiscal Policy191 Questions
Exam 7: Money, Prices and the Reserve Bank163 Questions
Exam 8: The Reserve Bank and the Economy202 Questions
Exam 9: The Aggregate Demand - Aggregate Supply Model124 Questions
Exam 10: Macroeconomic Policy128 Questions
Exam 11: The Economy in the Long Run: an Introduction to Economic Growth134 Questions
Exam 12: The Production Function Approach to Understanding Growth211 Questions
Exam 13: Savings, Capital Formation and Comparative Economic Growth203 Questions
Exam 14: International Trade175 Questions
Exam 15: Exchange Rates and the Open Economy143 Questions
Exam 16: The Balance of Payments: Net Exports and International Capital Flows247 Questions
Select questions type
The supply and demand model is not appropriate when analyzing markets where
(Multiple Choice)
4.8/5  (46)
(46)
Suppose that the equilibrium price of French fries rises,while the equilibrium quantity falls.The most consistent explanation for these observations is
(Multiple Choice)
4.8/5 (45)
The supply curve for any good is an upward-sloping function of
(Multiple Choice)
4.8/5 (34)
If the wages paid to workers in the steel industry rise,one would expect to see a(n)
(Multiple Choice)
4.8/5 (32)
Market Equilibrium and Shifts in Demand and Supply
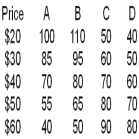 -Assume that column A and column C are the initial demand and supply curves.If supply changes to column D,one can infer the new equilibrium
(Multiple Choice)
4.9/5 (30)
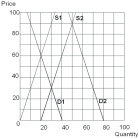 -Assume supply and demand both shift to the right so that D2 and S2 are now the relevant curves.The new equilibrium occurs at a price of _______ and ______ units exchanged.
(Multiple Choice)
4.9/5 (40)
Potential buyers and sellers of a particular good comprise the
(Multiple Choice)
4.8/5 (42)
Some economics students cite the following three factors that may cause the demand curve for houses in Calgary to shift to the right when the price of oil rises:
(1)the population in Calgary increase during oil booms;
(2)the income of individuals increase during oil booms;
(3)the price of the average house rises substantially during oil booms,but is not expected to rise further.
Which of the above factors were cited correctly?
(Multiple Choice)
4.7/5 (34)
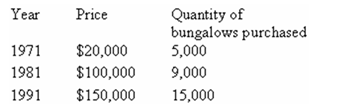 -The data show the quantity of small bungalows sold in a suburb of Toronto during the month of January.Based on the given data,we can conclude that:
(Multiple Choice)
4.9/5 (44)
Suppose that both the supply of beer and the demand for beer decrease.One can predict that the
(Multiple Choice)
4.8/5 (34)
Suppose that the price of beer increases.One would expect to see
(Multiple Choice)
5.0/5 (33)
An increase in the price of Colgate toothpaste,a substitute for Crest toothpaste,will cause
(Multiple Choice)
5.0/5 (42)
Suppose that the demand curve for a good is given by QD = 80 - PD,while the supply curve for the good is given by QS = 3PS.If the price in this market is currently equal to 10,then the quantity demanded is ______ and the quantity supplied is _______.
(Multiple Choice)
4.8/5 (39)
Suppose that both the equilibrium price and the equilibrium quantity of mustard rise.The most consistent explanation for these observations is
(Multiple Choice)
4.8/5 (51)
If the price of network servers increases,the impact on firms doing business through the internet will be to
(Multiple Choice)
4.7/5 (40)
One of the assumptions of the supply and demand model is that
(Multiple Choice)
4.9/5 (32)
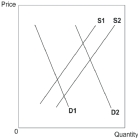 -Moving from supply curve S1 to supply curve S2 illustrates a(n)
(Multiple Choice)
4.9/5 (39)
At the beginning of the fall semester,university towns experience large increases in their populations,causing a(n)
(Multiple Choice)
4.7/5 (47)
Filters
- Essay(0)
- Multiple Choice(0)
- Short Answer(0)
- True False(0)
- Matching(0)