Exam 3: Where Prices Come Frome : The Interaction of Demand and Supply
Exam 1: Economics Foundations and Models160 Questions
Exam 2: Choices and Trade - Offs in the Market192 Questions
Exam 3: Where Prices Come Frome : The Interaction of Demand and Supply202 Questions
Exam 4: Elasticity: The Responsiveness of Demand and Supply226 Questions
Exam 5: Economic Efficiency , Government Price Setting and Taxes187 Questions
Exam 6: Concumer Choice and Behavioural Economics254 Questions
Exam 7: Technology , Production and Costs300 Questions
Exam 8: Firms in Perfectly Compitive Markets270 Questions
Exam 9: Monopoly Markets281 Questions
Exam 10: Monopolistic Competition : The Competitive Model in More Realistic Setting255 Questions
Exam 11: Oligopoly : Firms in Less Competitve Markets186 Questions
Exam 12: The Market for Labour and Other Factors of Production253 Questions
Exam 13: International Trade111 Questions
Exam 14: Government Intervention in the Market122 Questions
Exam 15: Externalities , Environmental Policy and Public Goods212 Questions
Exam 16: The Distribution of Income and Social Policy120 Questions
Select questions type
If, for a product, the quantity supplied exceeds the quantity demanded, the market price will fall until
(Multiple Choice)
4.8/5  (32)
(32)
Assume that the demand curve for MP3 players shifts to the right and the supply curve for MP3 players shift to the left, but the supply curve shifts less than the demand curve. As a result,
(Multiple Choice)
4.8/5 (40)
Refer to Figure 3-7. Assume that the graphs in this figure represent the demand and supply curves for used clothing, an inferior good. Which panel describes what happens in this market as a result of a decrease in income?
(Multiple Choice)
4.8/5 (41)
Which of the following will shift the demand curve for a good?
(Multiple Choice)
4.8/5 (32)
Refer to Figure 3-8. The graph in this figure illustrates an initial competitive equilibrium in the market for sugar at the intersection of D1 and S2 (point B). If there is a decrease in the price of fertilizer used on sugar cane and there is a decrease in tastes for sugar-sweetened soft drinks, how will the equilibrium point change?
(Multiple Choice)
4.9/5 (39)
An increase in the quantity of a product supplied is caused by an increase in the price of the product.
(True/False)
4.9/5 (43)
A surplus occurs when the actual selling price is above the market equilibrium price.
(True/False)
4.9/5 (35)
Refer to Figure 3-8. The graph in this figure illustrates an initial competitive equilibrium in the market for apples at the intersection of D1 and S1 (point A). If there is an increase in the wages of apple workers and an increase in the price of oranges, a substitute for apples, the equilibrium could move to which point?
(Multiple Choice)
4.9/5 (41)
Suppose that when the price of hamburgers decreases, the Landry family decreases their purchases of chicken nuggets. To the Landry family
(Multiple Choice)
4.8/5 (31)
In February, market analysts predict that the price of titanium will rise in March. What happens in the titanium market in February, holding everything else constant?
(Multiple Choice)
4.9/5 (34)
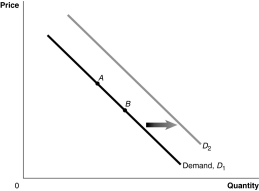 -Refer to Figure 3-1. A decrease in taste or preference would be represented by a movement from
(Multiple Choice)
4.8/5 (33)
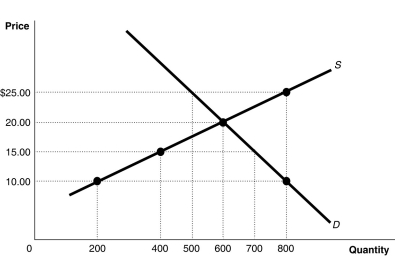 -Refer to Figure 3-4. If the current market price is $15, the market will achieve equilibrium by
(Multiple Choice)
4.9/5 (31)
The substitution effect explains why there is a direct relationship between the price of a product and the quantity of the product demanded.
(True/False)
4.8/5 (43)
If the population increases and input prices decrease, the equilibrium quantity of a product will definitely increase.
(True/False)
4.8/5 (31)
Refer to Figure 3-8. The graph in this figure illustrates an initial competitive equilibrium in the market for apples at the intersection of D2 and S1 (point C). Which of the following changes would cause the equilibrium to change to point B?
(Multiple Choice)
4.8/5 (45)
Draw a supply and demand graph showing an equilibrium price of $50 and an equilibrium quantity of 200 units. Explain what would happen if the selling price was $75, and illustrate this on the graph. Explain what would happen if the selling price was $25, and illustrate this on the graph. Be sure to label each axis and curve on the graph.
(Essay)
4.9/5 (34)
Suppose that when the price of strawberries decreases, Simone increases her purchase of whipped cream. To Simone
(Multiple Choice)
4.8/5 (37)
What are the two effects that explain the Law of Demand? Briefly explain each effect.
(Essay)
4.8/5 (42)
If consumers believe the price of LCD televisions will decrease in the future, this will cause the demand for LCD televisions to increase now.
(True/False)
4.8/5 (38)
Filters
- Essay(0)
- Multiple Choice(0)
- Short Answer(0)
- True False(0)
- Matching(0)