Exam 1: Limits, Alternatives, and Choices
Exam 1: Limits, Alternatives, and Choices257 Questions
Exam 2: The Market System and the Circular Flow112 Questions
Exam 3: Demand, Supply, and Market Equilibrium284 Questions
Exam 4: Market Failures: Public Goods and Externalities122 Questions
Exam 5: Governments Role and Government Failure109 Questions
Exam 6: An Introduction to Macroeconomics58 Questions
Exam 7: Measuring the Economys Output181 Questions
Exam 8: Economic Growth112 Questions
Exam 9: Business Cycles, Unemployment, and Inflation184 Questions
Exam 10: Basic Macroeconomic Relationships187 Questions
Exam 11: The Aggregate Expenditures Model230 Questions
Exam 12: Aggregate Demand and Aggregate Supply229 Questions
Exam 13: Fiscal Policy, Deficits, Surpluses, and Debt223 Questions
Exam 14: Money, Banking, and Money Creation203 Questions
Exam 15: Interest Rates and Monetary Policy238 Questions
Exam 16: Long-Run Macroeconomic Adjustments119 Questions
Exam 17: International Trade181 Questions
Exam 18: Exchange Rates and the Balance of Payments127 Questions
Select questions type
(The following economy produces two products. )
Production Possibilities Table
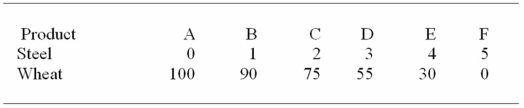 -Refer to the above table.A change from possibility C to B means that:
(Multiple Choice)
4.8/5  (31)
(31)
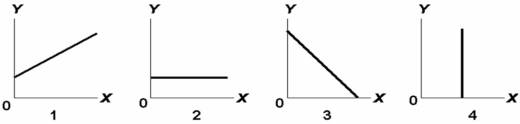 -Answer on the basis of the relationships shown in the above four figures.The amount of Y is directly related to the amount of X in:
(Multiple Choice)
4.8/5 (32)
Refer to the following production possibilities curves.Curve (a)is the current curve for the economy.Given production possibilities curve (a),the combination of capital and consumer goods indicated by point L: 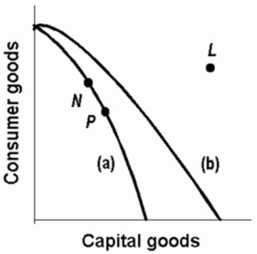
(Multiple Choice)
4.8/5 (38)
(The following economy produces two products. )
Production Possibilities Table
-The production possibilities curve represents which of the following?
(Multiple Choice)
4.9/5 (32)
Any combination of goods lying outside of the budget line:
(Multiple Choice)
4.8/5 (27)
Which of the following is assumed in constructing a typical production possibilities curve?
(Multiple Choice)
4.8/5 (36)
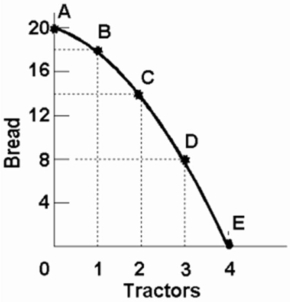 -Refer to the above diagram.Starting at point E,the production of successive units of bread will cost:
(Multiple Choice)
4.9/5 (28)
How is the economic perspective reflected in lines for fast food?
(Multiple Choice)
4.9/5 (45)
Refer to the diagram below.The concave shape of each production possibilities curve indicates that: 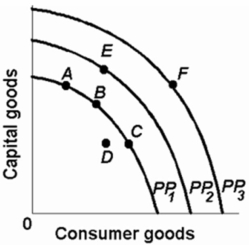
(Multiple Choice)
4.7/5 (31)
Filters
- Essay(0)
- Multiple Choice(0)
- Short Answer(0)
- True False(0)
- Matching(0)