Exam 3: Numerical Descriptive Measures
Exam 1: Defining and Collecting Data145 Questions
Exam 2: Organising and Visualising Data203 Questions
Exam 3: Numerical Descriptive Measures147 Questions
Exam 4: Basic Probability168 Questions
Exam 5: Some Important Discrete Probability Distributions172 Questions
Exam 6: The Normal Distribution and Other Continuous Distributions190 Questions
Exam 7: Sampling Distributions133 Questions
Exam 8: Confidence Interval Estimation186 Questions
Exam 9: Fundamentals of Hypothesis Testing: One-Sample Tests180 Questions
Exam 10: Hypothesis Testing: Two-Sample Tests175 Questions
Exam 11: Analysis of Variance148 Questions
Exam 12: Simple Linear Regression207 Questions
Exam 13: Introduction to Multiple Regression269 Questions
Exam 14: Time-Series Forecasting and Index Numbers201 Questions
Exam 15: Chi-Square Tests134 Questions
Exam 16: Multiple Regression Model Building93 Questions
Exam 17: Decision Making106 Questions
Exam 18: Statistical Applications in Quality Management119 Questions
Exam 19: Further Non-Parametric Tests50 Questions
Select questions type
Instruction 3-4
The ordered array below represents the number of cargo manifests approved by customs inspectors at the Port
of Brisbane in a sample of 35 days.
16, 17, 18, 18, 19, 20, 20, 21, 21, 21, 22, 22, 22, 22, 23, 23, 23, 23, 24, 24, 24, 25, 25, 26, 26, 26, 27, 28, 28, 29, 29, 31, 31, 32, 32
Note: For this sample, the sum of the observations is 838, the sum of the squares of the observations is 20,684, and the sum of the squared differences between each observation and the mean is 619.89.
-Referring to Instruction 3-4,the interquartile range of the customs data is _____________ .
(Short Answer)
4.8/5  (42)
(42)
In right-skewed distributions,which of the following is the correct statement?
(Multiple Choice)
4.9/5 (36)
According to the empirical rule,if the data form a "bell-shaped" normal distribution,_____________ percent of the observations will be contained within 3 standard deviations around the arithmetic mean.
(Multiple Choice)
4.9/5 (37)
Instruction 3-2
The data below represents the amount of grams of carbohydrates in a serving of breakfast cereal in a sample of 11 different servings.
11, 15, 23, 29, 19, 22, 21, 20, 15, 25, 17
-Referring to Instruction 3-2,the first quartile of the carbohydrate amounts is _____________ grams.
(Short Answer)
4.8/5 (41)
A manufacturer of flashlight batteries took a sample of 130 batteries from a day's production and used them continuously until they were drained.The number of hours until failure were recorded.Given below is the boxplot of the number of hours it took to drain each of the 130 batteries.The distribution of the number of hours is 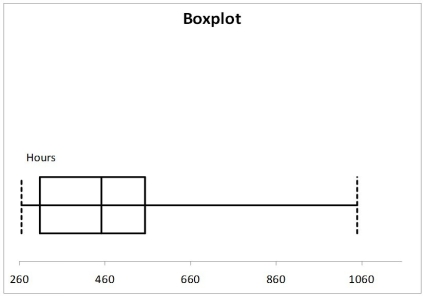
(Multiple Choice)
4.9/5 (31)
Data on the change in the cost of tuition,a shared dormitory room,and the most popular meal plan from one academic year to the next academic year for a sample of 100 public universities were collected.Below is the boxplot for the change in cost in dollars.The distribution of the change in cost is 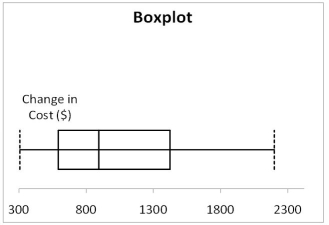
(Multiple Choice)
4.9/5 (33)
What does the vertical line on the right side of a boxplot represent?
(Multiple Choice)
4.8/5 (36)
According to the Chebyshev rule,at least what percentage of the observations in any data set are contained within a distance of 3 standard deviations around the mean?
(Multiple Choice)
4.7/5 (28)
Instruction 3-11
The ordered array below represents the number of cargo manifests approved by customs inspectors at the Port
of Brisbane in a sample of 35 days.
16, 17, 18, 18, 19, 20, 20, 21, 21, 21, 22, 22, 22, 22, 23, 23, 23, 23, 24, 24, 24, 25, 25, 26, 26, 26, 27, 28, 28, 29, 29, 31, 31, 32, 32
Note: For this sample, the sum of the observations is 838, the sum of the squares of the observations is 20,684,
and the sum of the squared differences between each observation and the mean is 619.89.
-Referring to Instruction 3-11,the five-number summary for the data in the customs sample consists of _____________ ,_____________ ,_____________ ,_____________ ,_____________ .
(Short Answer)
4.8/5 (41)
Instruction 3-3
The stem-and-leaf display below represents the number of vitamin supplements sold by a health food store in a sample of 16 days.
Stem Leaves 1H 99 2L 0023 2H 567 3L 034 3H 568 4L 1 Note (1): 1H means the "high teens" = 15, 16, 17, 18, or 19; 2L means the "low twenties" = 20, 21, 22, 23, or 24; 2H means the "high twenties" = 25, 26, 27, 28, or 29, etc.
Note (2): For this sample, the sum of the observations is 448, the sum of the squares of the observations is 13,356, and the sum of the squared differences between each observation and the mean is 812.
-Referring to Instruction 3-3,the coefficient of variation of the number of vitamin supplements sold in this sample is _____________ percent.
(Short Answer)
4.8/5 (38)
The rate of return for the S&P 500 over a seven year period is -0.029,-0.061,-0.493,-0.286,-0.160,-0.186 and -0.224.The geometric mean rate of return is _____________ .
(Short Answer)
4.9/5 (27)
The _________ of an observation measures how many standard deviations is the value from the mean.
(Multiple Choice)
4.8/5 (33)
Instruction 3-14
Given below are the rating and performance scores of 15 laptop computers.
Performanc e Score 115 191 153 194 236 184 184 216 185 183 189 202 192 141 Overall Rating 74 78 79 80 84 76 77 92 83 78 77 78 78 73
-Referring to Instruction 3-14,what is the sample correlation coefficient between the performance scores and the rating?
(Short Answer)
4.7/5 (38)
The more spread out,or dispersed,the data,the larger the range,interquartile range,variance and standard deviation.
(True/False)
4.8/5 (33)
Instruction 3-8
Given below is the frequency distribution of the number of defective tomatoes in 50 different shipments.
Defective Items Frequency 0 but less than 5 35 5 but less than 10 7 10 but less than 15 5 15 but less than 20 2 20 but less than 25 1 25 but less than 30 0
-Referring to Instruction 3-8,what is the approximate mean number of defective tomatoes?
(Short Answer)
4.9/5 (35)
Instruction 3-14
Given below are the rating and performance scores of 15 laptop computers.
Performanc e Score 115 191 153 194 236 184 184 216 185 183 189 202 192 141 Overall Rating 74 78 79 80 84 76 77 92 83 78 77 78 78 73
-Referring to Instruction 3-14,you will expect a decrease in the performance score of one laptop computer to be associated with _____________ .
(Short Answer)
4.8/5 (38)
The coefficient of variation is a measure of relative variation.
(True/False)
4.9/5 (35)
If the data set is approximately bell-shaped,the empirical rule will more accurately reflect the greater concentration of data close to the mean as compared to the Chebyshev rule.
(True/False)
4.8/5 (28)
In a perfectly symmetrical bell-shaped "normal" distribution,the median equals the mode,the arithmetic mean equals the mode,and the arithmetic mean equals the median.
(True/False)
4.8/5 (34)
Instruction 3-1
Health care issues are receiving much attention in both academic and political arenas. A sociologist recently conducted a survey of citizens over 60 years of age who have no private health insurance. The ages of 25 uninsured senior citizens were as follows:
60, 61, 62, 63, 64, 65, 66, 68, 68, 69, 70, 73, 73, 74, 75, 76, 76, 81, 81, 82, 86, 87, 89, 90, 92
-Referring to Instruction 3-1,identify which of the following is the correct statement.
(Multiple Choice)
4.9/5 (35)
Filters
- Essay(0)
- Multiple Choice(0)
- Short Answer(0)
- True False(0)
- Matching(0)