Exam 10: Hypothesis Testing: Two-Sample Tests
Exam 1: Defining and Collecting Data145 Questions
Exam 2: Organising and Visualising Data203 Questions
Exam 3: Numerical Descriptive Measures147 Questions
Exam 4: Basic Probability168 Questions
Exam 5: Some Important Discrete Probability Distributions172 Questions
Exam 6: The Normal Distribution and Other Continuous Distributions190 Questions
Exam 7: Sampling Distributions133 Questions
Exam 8: Confidence Interval Estimation186 Questions
Exam 9: Fundamentals of Hypothesis Testing: One-Sample Tests180 Questions
Exam 10: Hypothesis Testing: Two-Sample Tests175 Questions
Exam 11: Analysis of Variance148 Questions
Exam 12: Simple Linear Regression207 Questions
Exam 13: Introduction to Multiple Regression269 Questions
Exam 14: Time-Series Forecasting and Index Numbers201 Questions
Exam 15: Chi-Square Tests134 Questions
Exam 16: Multiple Regression Model Building93 Questions
Exam 17: Decision Making106 Questions
Exam 18: Statistical Applications in Quality Management119 Questions
Exam 19: Further Non-Parametric Tests50 Questions
Select questions type
Instruction 10-10
The dean of a college is interested in the proportion of graduates from his college who have a job offer on graduation day. He is particularly interested in seeing if there is a difference in this proportion for accounting and economics majors. In a random sample of 100 of each type of major at graduation, he found that 65 accounting students and 52 economics students had job offers. If the accounting students are designated as "Group 1" and the economics students are designated as "Group 2", perform the appropriate hypothesis test using a level of significance of 0.05.
-Referring to Instruction 10-13,construct a 99% confidence interval estimate of the difference in proportion between accounting majors and economic majors who have a job offer on graduation day.
(Short Answer)
4.8/5  (27)
(27)
When taking repeated measurements,the values themselves are the variable of interest rather than the difference between the values.
(True/False)
4.8/5 (35)
Instruction 10-10
A few years ago, Pepsi invited consumers to take the "Pepsi Challenge". Consumers were asked to decide which of the two soft drinks, Coke or Pepsi, they preferred in a blind taste test. Pepsi was interested in determining what factors played a role in people's taste preferences. One of the factors studied was the gender of the consumer. Below are the results of analyses comparing the taste preferences of men and women with the proportions depicting preference for Pepsi.
Males: n = 109, = 0.422018 Females: n = 52, = 0.25 - = 0.172018 Z = 2.11825
-Referring to Instruction 10-10,suppose Pepsi wanted to test to determine if the males preferred Pepsi less than the females.Using the test statistic given,compute the appropriate p-value for the test.
(Multiple Choice)
4.9/5 (31)
The t test for the mean difference between two related populations assumes that the
(Multiple Choice)
5.0/5 (37)
Instruction 10-1
Are Chinese managers more motivated than Australian managers? A randomly selected group of each were administered the Sarnoff Survey of Attitudes Toward Life (SSATL), which measures motivation for upward mobility. The SSATL scores are summarised below.
Australian Chinese Sample Size 211 100 Mean SSATL Score 65.75 79.83 Population Std. Dev. 11.07 6.41
-Referring to Instruction 10-1,give the null and alternative hypotheses to determine if the average SSATL score of Chinese managers differs from the average SSATL score of Australian managers.
(Multiple Choice)
4.8/5 (39)
A powerful women's group has claimed that men and women differ in attitudes about sexual discrimination.A group of 50 men (group 1)and 40 women (group 2)were asked if they thought sexual discrimination is a problem in Australia.Of those sampled,11 of the men and 19 of the women did believe that sexual discrimination is a problem.
-Assuming W designates women's responses and M designates men's,which of the following are the appropriate null and alternative hypotheses to test the group's claim?
(Multiple Choice)
4.9/5 (37)
Instruction 10-3
A real estate company is interested in testing whether the mean time that families in Gotham have been living in their current homes is less than families in Metropolis. Assume that the two population variances are equal. A random sample of 100 families from Gotham and a random sample of 150 families in Metropolis yield the following data on length of residence in current homes.
Gotham: months,
Metropolis: months,
-Referring to Instruction 10-3,suppose = 0.01.Which of the following represents the correct conclusion?
(Multiple Choice)
4.8/5 (31)
A powerful women's group has claimed that men and women differ in attitudes about sexual discrimination.A group of 50 men (group 1)and 40 women (group 2)were asked if they thought sexual discrimination is a problem in Australia.Of those sampled,11 of the men and 19 of the women did believe that sexual discrimination is a problem.Construct a 95% confidence interval estimate of the difference between the proportion of men and women who believe that sexual discrimination is a problem.
(Short Answer)
4.8/5 (39)
Instruction 10-6
Two samples each of size 25 are taken from independent populations assumed to be normally distributed with equal variances. The first sample has a mean of 35.5 and standard deviation of 3.0 while the second sample has a mean of 33.0 and standard deviation of 4.0.
-Referring to Instruction 10-6,the critical values for a two-tailed test of the null hypothesis of no difference in the population means at the = 0.05 level of significance are __________.
(Short Answer)
4.8/5 (35)
If you are testing for the difference between the means of two independent populations with samples of n1 = 20 and n2 = 20,the number of degrees of freedom is equal to
(Multiple Choice)
4.9/5 (29)
In testing for the differences between the means of two related populations,the__________ hypothesis is the hypothesis of "no differences".
(Short Answer)
4.7/5 (34)
Instruction 10-6
Two samples each of size 25 are taken from independent populations assumed to be normally distributed with equal variances. The first sample has a mean of 35.5 and standard deviation of 3.0 while the second sample has a mean of 33.0 and standard deviation of 4.0.
-Referring to Instruction 10-6,the pooled (i.e.,combinevariance is __________).
(Short Answer)
4.8/5 (36)
Instruction 10-3
A real estate company is interested in testing whether the mean time that families in Gotham have been living in their current homes is less than families in Metropolis. Assume that the two population variances are equal. A random sample of 100 families from Gotham and a random sample of 150 families in Metropolis yield the following data on length of residence in current homes.
Gotham: months,
Metropolis: months,
-Referring to Instruction 10-3,what is(are)the critical value(s)of the relevant hypothesis test if the level of significance is 0.01?
(Multiple Choice)
4.9/5 (42)
Instruction 10-1
Are Chinese managers more motivated than Australian managers? A randomly selected group of each were administered the Sarnoff Survey of Attitudes Toward Life (SSATL), which measures motivation for upward mobility. The SSATL scores are summarised below.
Australian Chinese Sample Size 211 100 Mean SSATL Score 65.75 79.83 Population Std. Dev. 11.07 6.41
-Referring to Instruction 10-1,judging from the way the data were collected,which test would likely be most appropriate to employ?
(Multiple Choice)
4.9/5 (33)
Instruction 10-11
The following Micosoft Excel output contains the results of a test to determine if the proportions of satisfied guests at two resorts are the same or different.
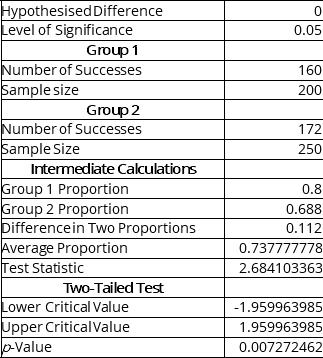 -Referring to Instruction 10-11,construct a 90% confidence interval estimate of the difference in the population proportion of satisfied guests between the two resorts.
(Short Answer)
4.7/5 (30)
A researcher is curious about the effect of sleep on students' test performances.He chooses 60 students and gives each two tests: one given after two hours of sleep and one after eight hours of sleep.The test the researcher should use would be a related samples test.
(True/False)
4.8/5 (31)
Instruction 10-4
To test the effectiveness of a business school preparation course, 8 students took a general business test before and after the course. The results are given below.
Student Exam Score Before Course Exam Score After Course (2) (1) 1 530 670 2 650 770 3 910 1,000 4 700 710 5 450 550 6 820 870 7 820 770 8 630 610
-Referring to Instruction 10-4,what is the critical value for testing at the 5% level of significance whether the business school preparation course is effective in improving exam scores?
(Multiple Choice)
4.8/5 (28)
Instruction 10-9
The use of preservatives by food processors has become a controversial issue. Suppose two preservatives are
extensively tested and determined safe for use in meats. A processor wants to compare the preservatives for their effects on retarding spoilage. Suppose 15 cuts of fresh meat are treated with preservative A and 15 are treated with preservative B, and the number of hours until spoilage begins is recorded for each of the 30 cuts of meat. The results are summarised in the table below.
Preservative A Preservative B =106.4 =56.54 =10.3 =13.4
-Referring to Instruction 10-9,suppose ? = 0.05.Which of the following represents the result of the relevant hypothesis test?
(Multiple Choice)
4.9/5 (34)
Instruction 10-3
A real estate company is interested in testing whether the mean time that families in Gotham have been living in their current homes is less than families in Metropolis. Assume that the two population variances are equal. A random sample of 100 families from Gotham and a random sample of 150 families in Metropolis yield the following data on length of residence in current homes.
Gotham: months,
Metropolis: months,
-Referring to Instruction 10-3,what is the estimated standard error of the difference between the two sample means?
(Multiple Choice)
4.8/5 (36)
Instruction 10-3
A real estate company is interested in testing whether the mean time that families in Gotham have been living in their current homes is less than families in Metropolis. Assume that the two population variances are equal. A random sample of 100 families from Gotham and a random sample of 150 families in Metropolis yield the following data on length of residence in current homes.
Gotham: months,
Metropolis: months,
-Referring to Instruction 10-3,suppose = 0.05.Which of the following represents the result of the relevant hypothesis test?
(Multiple Choice)
4.8/5 (28)
Filters
- Essay(0)
- Multiple Choice(0)
- Short Answer(0)
- True False(0)
- Matching(0)