Exam 4: Economic Efficiency, government Price Setting, and Taxes
Exam 1: Economics: Foundations and Models211 Questions
Exam 2: Trade-Offs,comparative Advantage,and the Market System239 Questions
Exam 3: Where Prices Come From: the Interaction of Demand and Supply233 Questions
Exam 4: Economic Efficiency, government Price Setting, and Taxes211 Questions
Exam 5: The Economics of Health Care164 Questions
Exam 6: Firms,the Stock Market,and Corporate Governance276 Questions
Exam 7: Comparative Advantage and the Gains From International Trade190 Questions
Exam 8: GDP: Measuring Total Production and Income266 Questions
Exam 9: Unemployment and Inflation292 Questions
Exam 10: Economic Growth, the Financial System, and Business Cycles257 Questions
Exam 11: Long-Run Economic Growth: Sources and Policies268 Questions
Exam 12: Aggregate Expenditure and Output in the Short Run306 Questions
Exam 13: Aggregate Demand and Aggregate Supply Analysis284 Questions
Exam 14: Money, banks, and the Federal Reserve System280 Questions
Exam 15: Monetary Policy277 Questions
Exam 16: Fiscal Policy303 Questions
Exam 17: Inflation, unemployment, and Federal Reserve Policy257 Questions
Exam 18: Macroeconomics in an Open Economy278 Questions
Exam 19: The International Financial System262 Questions
Select questions type
If buyers were required to pay the federal excise tax on gasoline directly to the government,the demand curve for gasoline would shift up.
Free
(True/False)
4.8/5  (31)
(31)
Correct Answer: Verified
False
Table 4-3
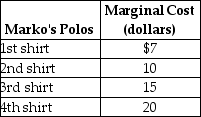 -Refer to Table 4-3.The table above lists the marginal cost of polo shirts by Marko's,a firm that specializes in producing men's clothing.If the price of polo shirts increases from $15 to $20
Free
(Multiple Choice)
4.8/5 (37)
Correct Answer:Verified
C
Figure 4-1 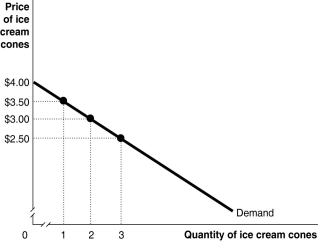 Figure 4-1 shows Kendra's demand curve for ice-cream cones.
-Refer to Figure 4-1.Kendra's marginal benefit from consuming the second ice cream cone is
Figure 4-1 shows Kendra's demand curve for ice-cream cones.
-Refer to Figure 4-1.Kendra's marginal benefit from consuming the second ice cream cone is
Free
(Multiple Choice)
5.0/5 (38)
Correct Answer:Verified
C
Table 4-4
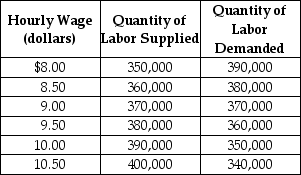 Table 4-4 shows the demand and supply schedules for the low-skilled labor market in the city of Westover.
-Refer to Table 4-4.Suppose that the quantity of labor supplied increases by 40,000 at each wage level.What are the new free market equilibrium hourly wage and the new equilibrium quantity of labor?
Table 4-4 shows the demand and supply schedules for the low-skilled labor market in the city of Westover.
-Refer to Table 4-4.Suppose that the quantity of labor supplied increases by 40,000 at each wage level.What are the new free market equilibrium hourly wage and the new equilibrium quantity of labor?
(Multiple Choice)
4.8/5 (34)
Figure 4-3 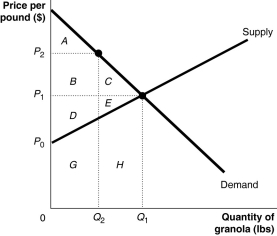 Figure 4-3 shows the market for granola.The market is initially in equilibrium at a price of P1 and a quantity of Q1.Now suppose producers decide to cut output to Q2 in order to raise the price to P2.
-Refer to Figure 4-3.What area represents producer surplus at P2?
Figure 4-3 shows the market for granola.The market is initially in equilibrium at a price of P1 and a quantity of Q1.Now suppose producers decide to cut output to Q2 in order to raise the price to P2.
-Refer to Figure 4-3.What area represents producer surplus at P2?
(Multiple Choice)
4.7/5 (31)
Which of the following is a result of government price controls?
(Multiple Choice)
4.8/5 (33)
Figure 4-3 Figure 4-3 shows the market for granola.The market is initially in equilibrium at a price of P1 and a quantity of Q1.Now suppose producers decide to cut output to Q2 in order to raise the price to P2.
-Refer to Figure 4-3.What area represents the deadweight loss at P2?
(Multiple Choice)
4.7/5 (42)
Figure 4-2 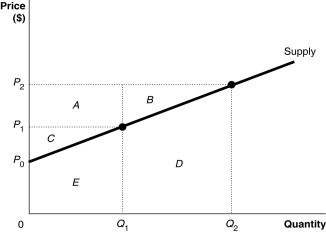 -Refer to Figure 4-2.What area represents producer surplus at a price of P1?
(Multiple Choice)
4.8/5 (42)
Table 4-4
Table 4-4 shows the demand and supply schedules for the low-skilled labor market in the city of Westover.
-Refer to Table 4-4.What is the equilibrium hourly wage (W*)and the equilibrium quantity of labor (Q*)?
(Multiple Choice)
4.8/5 (35)
If the quantity of jelly beans supplied is represented by the equation QS = -20 +4P then the corresponding price of jelly beans is represented by the equation
(Multiple Choice)
4.8/5 (30)
Marco goes to the pet store to buy a dozen Koi fish for his new Koi pond.He is willing to pay $200 for the dozen fish,but buys them for a total of $140.Marco's consumer surplus from the purchase is
(Multiple Choice)
4.8/5 (25)
Figure 4-1 Figure 4-1 shows Kendra's demand curve for ice-cream cones.
-Refer to Figure 4-1.If the market price is $2.50,what is the consumer surplus on the second ice cream cone?
(Multiple Choice)
4.8/5 (33)
Table 4-2
 -Refer to Table 4-2.The table above lists the highest prices five consumers are willing to pay for a concert ticket.If the price of one ticket is $50
(Multiple Choice)
4.7/5 (39)
If the government implements a price ceiling on insulin,this will have all of the following effects on the market for insulin except
(Multiple Choice)
4.9/5 (34)
Table 4-4
Table 4-4 shows the demand and supply schedules for the low-skilled labor market in the city of Westover.
-Refer to Table 4-4.If a minimum wage of $10.50 an hour is mandated,what is the quantity of labor demanded?
(Multiple Choice)
4.9/5 (34)
Suppose the demand curve for a product is downward sloping and the supply curve is upward sloping.If a unit tax is imposed in the market for this product,
(Multiple Choice)
4.7/5 (43)
Figure 4-5 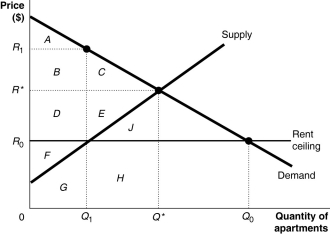 Figure 4-5 shows the market for apartments in Bay City.Recently,the government imposed a rent ceiling at R0.
-Refer to Figure 4-5.Suppose that instead of a price ceiling,the government imposed a price floor of R1.What is the quantity of apartments demanded at the new price?
Figure 4-5 shows the market for apartments in Bay City.Recently,the government imposed a rent ceiling at R0.
-Refer to Figure 4-5.Suppose that instead of a price ceiling,the government imposed a price floor of R1.What is the quantity of apartments demanded at the new price?
(Multiple Choice)
4.9/5 (36)
Filters
- Essay(0)
- Multiple Choice(0)
- Short Answer(0)
- True False(0)
- Matching(0)