Exam 2: Thinking Like an Economist
Exam 1: Ten Principles of Economics216 Questions
Exam 2: Thinking Like an Economist234 Questions
Exam 3: Interdependence and the Gains From Trade206 Questions
Exam 4: The Market Forces of Supply and Demand349 Questions
Exam 5: Measuring a Nations Income169 Questions
Exam 6: Measuring the Cost of Living181 Questions
Exam 7: Production and Growth191 Questions
Exam 8: Saving, investment, and the Financial System213 Questions
Exam 9: Unemployment and Its Natural Rate197 Questions
Exam 10: The Monetary System204 Questions
Exam 11: Money Growth and Inflation195 Questions
Exam 12: Open-Economy Macroeconomics: Basic Concepts220 Questions
Exam 13: A Macroeconomic Theory of the Small Open Economy196 Questions
Exam 14: Aggregate Demand and Aggregate Supply257 Questions
Exam 15: The Influence of Monetary and Fiscal Policy on Aggregate Demand222 Questions
Exam 16: The Short-Run Tradeoff Between Inflation and Unemployment207 Questions
Exam 17: Five Debates Over Macroeconomic Policy119 Questions
Select questions type
Figure 2-2 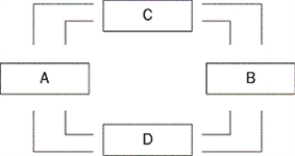 -Refer to Figure 2-2.In which market are firms sellers?
(Multiple Choice)
4.9/5  (39)
(39)
What are economists who try to explain economic phenomena considered?
(Multiple Choice)
4.9/5 (29)
How can the production possibilities frontiers shift outward?
(Multiple Choice)
4.7/5 (34)
Since natural experiments offered by history cannot be used in economics,carefully constructed laboratory experiments must be used.
(True/False)
4.9/5 (38)
When a production possibilities frontier shifts outward,what concept is being demonstrated?
(Multiple Choice)
4.9/5 (36)
Figure 2-6 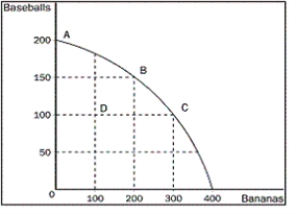 -Refer to Figure 2-6.What was the most likely cause of the movement from point C to point D?
(Multiple Choice)
4.8/5 (39)
The tradeoff between the production of different goods can change because of technological improvement over time.
(True/False)
4.7/5 (35)
The purpose of this exercise is to show you how a mathematical (economic)model can be adjusted to better represent an economic phenomenon.Consider the equation Y=2×L,where Y is the number of apple pies that Jonathan can cook in L hours.This equation describes the process of producing apple pies.
a.In a graph,draw the line described by the equation Y=2×L.What is the slope of this line? What does the slope represent? Note that the slope is the same for the first,second,and all subsequent hours.In other words,the slope is constant.Why is the constant slope of the line a limitation of your model?
b.How should the slope change for higher values of L,the number of hours worked,to account for the fact that the worker might get tired?
c.How could you modify the model to capture the change in slope you identified in part b?
(Essay)
4.9/5 (45)
Figure 2-2
-Refer to Figure 2-2.Who owns the factors of production?
(Multiple Choice)
4.9/5 (47)
In which department do economists help enforce competition laws?
(Multiple Choice)
4.8/5 (43)
When an economy is operating inside its production possibilities frontier,what do we know?
(Multiple Choice)
4.9/5 (38)
Why are production possibilities frontiers usually bowed outward?
(Multiple Choice)
4.8/5 (31)
What will the slope of a fairly flat upward-sloping line be?
(Multiple Choice)
5.0/5 (41)
The prairie dog has always been considered a problem for Canadian cattle ranchers.They dig holes that cattle and horses can step in,and they eat grass necessary for cattle.Recently,ranchers have discovered that there is a demand for prairie dogs as pets.In some areas,prairie dogs can sell for as high as $150.Cattlemen are now fencing off prairie dog towns on their land so these towns will not be disturbed by their cattle.
Draw a production possibilities frontier demonstrating a rancher's production option between cattle production and prairie dog production,showing increasing opportunity cost and what would happen in each of the following situations (using a separate graph for each situation):
a.The outcome is efficient,with ranchers choosing to produce equal numbers of cattle and prairie dogs.
b.As a protest against the government introducing the grey wolf back into the wild in their province,ranchers decide not to use 25% of the available grassland for grazing.
c.The price of prairie dogs increases to $200 each,so ranchers decide to allot additional land for prairie dogs.
d.The government grants new leases to ranchers,giving them 10,000 new hectares of grassland each for grazing.
e.A drought destroys most of the available grass for grazing of cattle,but not prairie dogs since they also eat plant roots.
(Essay)
4.7/5 (43)
Filters
- Essay(0)
- Multiple Choice(0)
- Short Answer(0)
- True False(0)
- Matching(0)