Exam 15: A Simple Model of the Macro Economy
Exam 1: Thinking Like an Economist89 Questions
Exam 2: Applying Graphs to Economics37 Questions
Exam 3: Production Possibilities and Opportunity Cost122 Questions
Exam 4: Market Demand and Supply120 Questions
Exam 5: Markets in Action120 Questions
Exam 6: Elasticity of Demand and Supply118 Questions
Exam 7: Production Costs119 Questions
Exam 8: Perfect Competition124 Questions
Exam 9: Monopoly120 Questions
Exam 10: Monopolistic Competition and Oligopoly124 Questions
Exam 11: Policy Issues: Housing Affordability and Climate Change79 Questions
Exam 12: Measuring the Size of the Economy124 Questions
Exam 13: Business Cycles and Economic Growth120 Questions
Exam 14: Inflation and Unemployment116 Questions
Exam 15: A Simple Model of the Macro Economy134 Questions
Exam 16: The Monetary and Financial System123 Questions
Exam 17: Macroeconomic Policy I: Monetary Policy120 Questions
Exam 18: Macroeconomic Policy II: Fiscal Policy123 Questions
Exam 19: International Trade and Finance132 Questions
Select questions type
The classical theory that states that 'supply creates its own demand' was developed by:
(Multiple Choice)
4.7/5  (30)
(30)
Suppose the economy is on the intermediate range of the aggregate supply curve. Which of the following would reduce both real GDP and the price level?
(Multiple Choice)
4.8/5 (30)
A large decrease in Australia's share market index may cause:
(Multiple Choice)
4.7/5 (32)
The aggregate supply curve shows the relationship between the price level and the level of nominal GDP produced by the nation's economy.
(True/False)
4.8/5 (33)
As the aggregate demand curve shifts from AD1 to AD2 in Exhibit 14.3, the economy experiences:
(Multiple Choice)
4.8/5 (40)
The full employment level of real GDP can be represented on an aggregate supply and demand diagram as a/an:
(Multiple Choice)
4.9/5 (24)
If your disposable personal income increases from $30 000 to $40 000 and your savings increase from $2000 to $4000, your marginal propensity to save (MPS) is:
(Multiple Choice)
4.9/5 (26)
Narrbegin Exhibit 14.2 Aggregate demand and supply 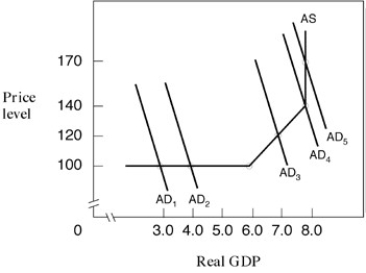 -In Exhibit 14.2, if aggregate demand shifts from AD5 to AD4, real GDP will:
(Multiple Choice)
4.9/5 (30)
What is the title of the John Maynard Keynes's book published in 1936 that challenged the classical self-correction economic theory?
(Multiple Choice)
4.8/5 (42)
Narrbegin Exhibit 14.2 Aggregate demand and supply
-In Exhibit 14.2, if aggregate demand shifts from AD1 to AD3, real GDP will:
(Multiple Choice)
4.9/5 (40)
In the intermediate range of the aggregate supply curve, higher aggregate demand will increase:
(Multiple Choice)
4.9/5 (44)
Other factors held constant, an increase in resource prices will shift the aggregate:
(Multiple Choice)
5.0/5 (44)
To illustrate the classical argument that 'supply creates its own demand', the aggregate supply curve should be drawn:
(Multiple Choice)
4.7/5 (42)
Filters
- Essay(0)
- Multiple Choice(0)
- Short Answer(0)
- True False(0)
- Matching(0)