Exam 2: Understanding Graphs-Appendix
Exam 1: The Art and Science of Economic Analysis147 Questions
Exam 2: Understanding Graphs-Appendix64 Questions
Exam 3: Economic Tools and Economics Systems195 Questions
Exam 4: Economic Decision Makers200 Questions
Exam 5: Demand, Supply, and Markets232 Questions
Exam 6: Introduction to Macroeconomics162 Questions
Exam 7: Tracking the Us Economy213 Questions
Exam 8: Unemployment and Inflation202 Questions
Exam 9: Productivity and Growth119 Questions
Exam 10: Aaggregate Expenditure and Agregate Demand179 Questions
Exam 11: Aggregate Expenditure and Aggregate Demand148 Questions
Exam 12: Aggregate Supply213 Questions
Exam 13: Fiscal Policy240 Questions
Exam 14: Federal Budgets and Public Policy158 Questions
Exam 15: Money and the Financial System209 Questions
Exam 16: Banking and the Money Supply229 Questions
Exam 17: Monetary Theory and Policy186 Questions
Exam 18: Macro Policy Debate: Active or Passive189 Questions
Exam 19: International Trade163 Questions
Exam 20: International Finance231 Questions
Exam 21: Economic Development110 Questions
Select questions type
Exhibit 1-16
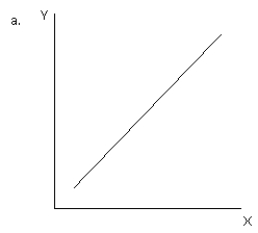
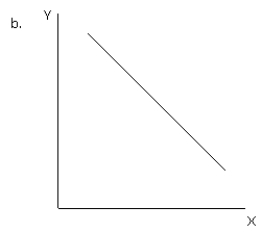
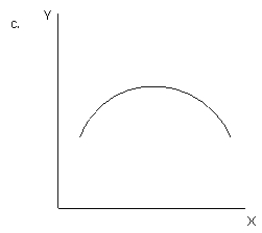
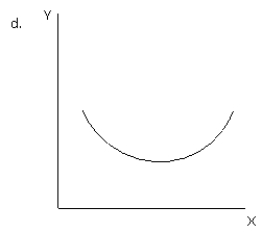
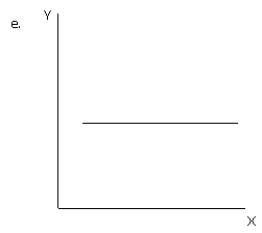 -Refer to exhibit 1-16. Which of the graphs illustrates a direct or positive relationship between variable X and variable Y?
(Multiple Choice)
4.8/5  (43)
(43)
Filters
- Essay(0)
- Multiple Choice(0)
- Short Answer(0)
- True False(0)
- Matching(0)