Exam 2: Understanding Graphs-Appendix
Exam 1: The Art and Science of Economic Analysis147 Questions
Exam 2: Understanding Graphs-Appendix64 Questions
Exam 3: Economic Tools and Economics Systems195 Questions
Exam 4: Economic Decision Makers200 Questions
Exam 5: Demand, Supply, and Markets232 Questions
Exam 6: Introduction to Macroeconomics162 Questions
Exam 7: Tracking the Us Economy213 Questions
Exam 8: Unemployment and Inflation202 Questions
Exam 9: Productivity and Growth119 Questions
Exam 10: Aaggregate Expenditure and Agregate Demand179 Questions
Exam 11: Aggregate Expenditure and Aggregate Demand148 Questions
Exam 12: Aggregate Supply213 Questions
Exam 13: Fiscal Policy240 Questions
Exam 14: Federal Budgets and Public Policy158 Questions
Exam 15: Money and the Financial System209 Questions
Exam 16: Banking and the Money Supply229 Questions
Exam 17: Monetary Theory and Policy186 Questions
Exam 18: Macro Policy Debate: Active or Passive189 Questions
Exam 19: International Trade163 Questions
Exam 20: International Finance231 Questions
Exam 21: Economic Development110 Questions
Select questions type
If the dependent variable Y is directly related to the independent variable X, this means that changes in X cause changes in Y.
Free
(True/False)
4.7/5  (29)
(29)
Correct Answer: Verified
False
The slope of a horizontal straight line is infinity.
Free
(True/False)
4.7/5 (18)
Correct Answer:Verified
False
The numerical value of the slope of a line depends in part on the units of measurement used.
Free
(True/False)
4.8/5 (38)
Correct Answer:Verified
True
Exhibit 1-5
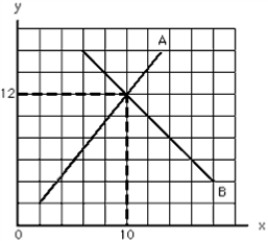 -In Exhibit 1-2, curve B has a __________ slope that is __________ at every point.
(Multiple Choice)
4.9/5 (35)
Exhibit 1-9
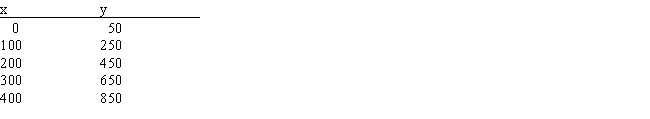 -Using the values in Exhibit 1-7, calculate the slope of a line graphed with x on the horizontal axis and y on the vertical axis.
(Multiple Choice)
4.8/5 (35)
Suppose a graph with Ron's weight on the vertical axis and his consumption of ice cream on the horizontal axis indicated that for each serving of ice cream he ate, Ron would gain 3 pounds, regardless of how much ice cream he had already eaten. This graph would show a
(Multiple Choice)
4.9/5 (36)
The part of a graph that is most applicable to marginal analysis is the
(Multiple Choice)
4.8/5 (37)
Most economics graphs reflect the relationship between how many economic variables?
(Multiple Choice)
4.9/5 (36)
Exhibit 1-16
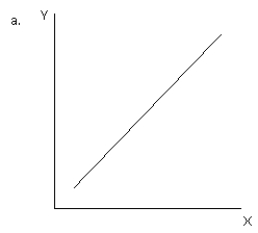
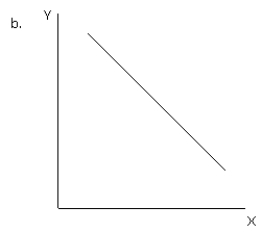
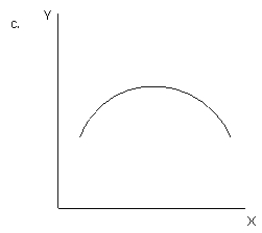
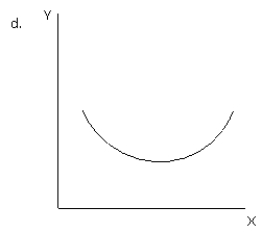
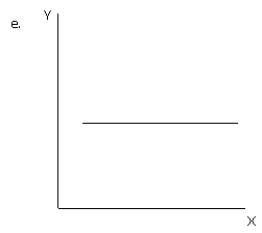 -Refer to exhibit 1-16. Which of the graphs illustrates an inverse or negative relationship between variable X and variable Y?
(Multiple Choice)
4.9/5 (37)
Moderate exercise is better than none, but excessive exercise is harmful. What is the shape of the graph of health benefits versus hours of exercise per week if health benefits are measured on the vertical axis and exercise is measured on the horizontal axis?
(Multiple Choice)
4.8/5 (30)
Suppose the cost of producing copper tubing is $1 per foot. If production costs were measured on the vertical axis and quantity of copper tubing were measured on the horizontal axis, which of the following lines would have the smallest slope?
(Multiple Choice)
4.9/5 (35)
Filters
- Essay(0)
- Multiple Choice(0)
- Short Answer(0)
- True False(0)
- Matching(0)