Exam 2: Summarizing Data: Frequency Distributions in Tables and Graphs
Exam 1: Introduction to Statistics80 Questions
Exam 2: Summarizing Data: Frequency Distributions in Tables and Graphs80 Questions
Exam 3: Summarizing Data: Central Tendency80 Questions
Exam 4: Summarizing Data: Variability80 Questions
Exam 5: Probability80 Questions
Exam 6: Probability, Normal Distributions, and Z Scores80 Questions
Exam 7: Probability and Sampling Distributions80 Questions
Exam 8: Hypothesis Testing: Significance, Effect Size, and Power80 Questions
Exam 9: Testing Means: One-Sample and Two-Independent Sample T Tests80 Questions
Exam 10: Testing Means: Related Samples T Test79 Questions
Exam 11: Estimation and Confidence Intervals60 Questions
Exam 12: Analysis of Variance: One-Way Between-Subjects Design80 Questions
Exam 13: Analysis of Variance: One-Way Within-Subjects Repeated Measures Design80 Questions
Exam 14: Analysis of Variance: Two-Way Between-Subjects Factorial Design80 Questions
Exam 15: Correlation80 Questions
Exam 16: Linear Regression and Multiple Regression80 Questions
Exam 17: Nonparametric Tests: Chi-Square Tests80 Questions
Exam 18: Nonparametric Tests: Tests for Ordinal Data60 Questions
Select questions type
A student scores in the 80th percentile on an exam.What does this mean in comparison to all other students?
Free
(Multiple Choice)
4.8/5  (38)
(38)
Correct Answer: Verified
A
A researcher distributes frequencies into the following intervals: 1-10,11-20,21-30,31-40,41-50,and 51 and above.What is wrong with this frequency distribution?
Free
(Multiple Choice)
4.7/5 (39)
Correct Answer:Verified
D
The following is a simple frequency distribution table.Suppose we convert this table to a cumulative frequency distribution.The frequencies in each interval of the cumulative frequency distribution would be 
Free
(Multiple Choice)
4.7/5 (33)
Correct Answer:Verified
C
The following is a simple frequency distribution table.If we convert this frequency distribution to relative percentages,which of the following gives the corresponding percentages in each interval listed from the top down. 
(Multiple Choice)
5.0/5 (37)
A researcher distributes frequencies into the following classes: absent,tardy,present.What type of data are distributed?
(Multiple Choice)
4.8/5 (30)
A researcher reports that 12 persons in a sample of 60 reported getting between 4 and 6 hours of sleep per night.What is the relative percentage for this interval?
(Multiple Choice)
4.8/5 (33)
A researcher records the number of children at a local school from single-,divorced-,and married-parent homes.This frequency data would be best displayed as a
(Multiple Choice)
4.9/5 (31)
A circular graph that displays the relative percentage of a frequency distribution into sectors is called a scatter gram.
(True/False)
4.7/5 (33)
A researcher finds that 12% of participants make between 3-5 visits to a physician each year.What are the real limits for this interval?
(Multiple Choice)
4.8/5 (36)
The ________ is the percentage of scores with values that fall below a specified score in a distribution,is called the:
(Multiple Choice)
4.8/5 (30)
A relative frequency is typically used with smaller,but not larger,data sets.
(True/False)
4.9/5 (39)
When cumulating frequencies from the bottom up,the data are discussed in terms of
(Multiple Choice)
4.7/5 (29)
A histogram is basically a bar chart where the bars do not touch.
(True/False)
4.8/5 (33)
Whether you cumulate a frequency distribution from the bottom up or the top down depends on how you want to discuss the data.
(True/False)
4.7/5 (41)
State the type of graphical display for Graph A and Graph B. 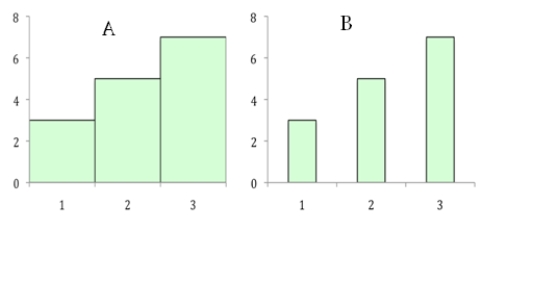
(Multiple Choice)
4.9/5 (44)
A researcher measures the time (in seconds)that it takes children to complete a basic reading skills task.What type of graphical display would be most appropriate for summarizing the frequency of children falling into different intervals of time?
(Multiple Choice)
4.9/5 (39)
As a general rule,a simple frequency distribution should have between
(Multiple Choice)
4.9/5 (42)
Filters
- Essay(0)
- Multiple Choice(0)
- Short Answer(0)
- True False(0)
- Matching(0)