Exam 9: Comparative Advantage and the Gains From International Trade
Exam 1: Economics: Foundations and Models233 Questions
Exam 2: Trade-Offs, comparative Advantage, and the Market System259 Questions
Exam 3: Where Prices Come From: the Interaction of Demand and Supply242 Questions
Exam 4: Economic Efficiency, government Price Setting, and Taxes208 Questions
Exam 5: Externalities, environmental Policy, and Public Goods267 Questions
Exam 6: Elasticity: The Responsiveness of Demand and Supply295 Questions
Exam 7: The Economics of Health Care169 Questions
Exam 8: Firms, the Stock Market, and Corporate Governance278 Questions
Exam 9: Comparative Advantage and the Gains From International Trade189 Questions
Exam 10: Consumer Choice and Behavioral Economics302 Questions
Exam 11: Technology, production, and Costs330 Questions
Exam 12: Firms in Perfectly Competitive Markets298 Questions
Exam 13: Monopolistic Competition: the Competitive Model in a More Realistic Setting278 Questions
Exam 14: Oligopoly: Firms in Less Competitive Markets262 Questions
Exam 15: Monopoly and Antitrust Policy271 Questions
Exam 16: Pricing Strategy263 Questions
Exam 17: The Markets for Labor and Other Factors of Production286 Questions
Exam 18: Public Choice,taxes,and the Distribution of Income258 Questions
Select questions type
Free trade ________ living standards by ________ economic efficiency.
(Multiple Choice)
4.9/5  (34)
(34)
Figure 9-3 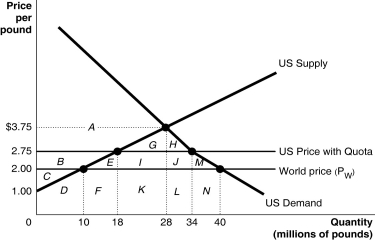 Since 1953 the United States has imposed a quota to limit the imports of peanuts. Figure 9-3 illustrates the impact of the quota.
-Refer to Figure 9-3.What is the area that represents revenue to foreign producers who are granted permission to sell in the U.S.market when there is a quota?
Since 1953 the United States has imposed a quota to limit the imports of peanuts. Figure 9-3 illustrates the impact of the quota.
-Refer to Figure 9-3.What is the area that represents revenue to foreign producers who are granted permission to sell in the U.S.market when there is a quota?
(Multiple Choice)
4.8/5 (40)
Table 9-2
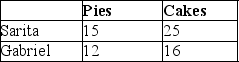 Sarita and Gabriel own S&G Bakery. Table 9-2 lists the number of pies and cakes Sarita and Gabriel can each bake in one day.
-Refer to Table 9-2.Select the statement that accurately interprets the data in the table.
Sarita and Gabriel own S&G Bakery. Table 9-2 lists the number of pies and cakes Sarita and Gabriel can each bake in one day.
-Refer to Table 9-2.Select the statement that accurately interprets the data in the table.
(Multiple Choice)
4.7/5 (28)
Figure 9-1 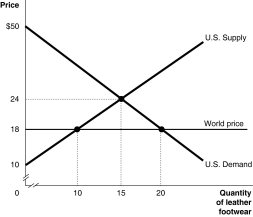 Figure 9-1 shows the U.S. demand and supply for leather footwear.
-Refer to Figure 9-1.Under autarky,the deadweight loss is
Figure 9-1 shows the U.S. demand and supply for leather footwear.
-Refer to Figure 9-1.Under autarky,the deadweight loss is
(Multiple Choice)
4.9/5 (34)
As a percentage of GDP,exports are greater than imports for which of the following countries?
(Multiple Choice)
4.8/5 (47)
The process of countries becoming more open to foreign trade and investment is known as
(Multiple Choice)
4.9/5 (36)
The U.S.economy would gain from the elimination of tariffs and quotas even if other countries do not reduce their tariffs and quotas.
(True/False)
4.9/5 (35)
Figure 9-2 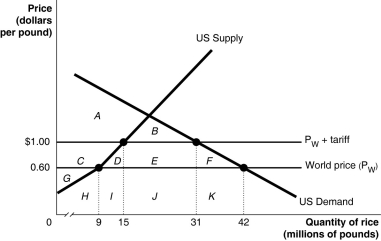 Suppose the U.S. government imposes a $0.40 per pound tariff on rice imports. Figure 9-2 shows the impact of this tariff.
-Refer to Figure 9-2.The tariff revenue collected by the government equals the area
Suppose the U.S. government imposes a $0.40 per pound tariff on rice imports. Figure 9-2 shows the impact of this tariff.
-Refer to Figure 9-2.The tariff revenue collected by the government equals the area
(Multiple Choice)
4.7/5 (36)
Figure 9-5 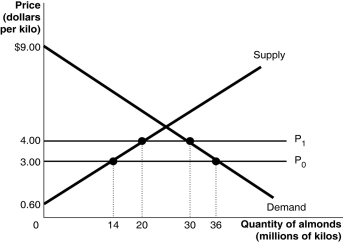 Bragabong currently both produces and imports almonds. The government of Bragabong decides to restrict international trade in almonds by imposing a quota that allows imports of only 10 million kilos each year. Figure 9-5 shows the estimated demand and supply curves for almonds in Bragabong and the results of imposing the quota.
-Use Figure 9-5 to answer questions a-j .
a.If there is no quota what is the domestic price of almonds and what is the quantity of almonds demanded by consumers?
b.If there is no quota how many kilos of almonds would domestic producers supply and what quantity would be imported?
c.If there is no quota what is the dollar value of consumer surplus?
d.If there is no quota what is the dollar value of producer surplus received by producers in Bragabong?
e.If there is no quota what is the revenue received by foreign producers who supply almonds to Bragabong?
f.With a quota in place what is the price that consumers of Bragabong must now pay and what is the quantity demanded?
g.With a quota in place what is the dollar value of consumer surplus? Are consumers better off?
h.With a quota in place what is the dollar value of producer surplus received by producers in Bragabong? Are domestic producers better off?
i.Calculate the revenue to foreign producers who are granted permission to sell in Bragabong after the imposition of the quota.
j.Calculate the deadweight loss as a result of the quota.
Bragabong currently both produces and imports almonds. The government of Bragabong decides to restrict international trade in almonds by imposing a quota that allows imports of only 10 million kilos each year. Figure 9-5 shows the estimated demand and supply curves for almonds in Bragabong and the results of imposing the quota.
-Use Figure 9-5 to answer questions a-j .
a.If there is no quota what is the domestic price of almonds and what is the quantity of almonds demanded by consumers?
b.If there is no quota how many kilos of almonds would domestic producers supply and what quantity would be imported?
c.If there is no quota what is the dollar value of consumer surplus?
d.If there is no quota what is the dollar value of producer surplus received by producers in Bragabong?
e.If there is no quota what is the revenue received by foreign producers who supply almonds to Bragabong?
f.With a quota in place what is the price that consumers of Bragabong must now pay and what is the quantity demanded?
g.With a quota in place what is the dollar value of consumer surplus? Are consumers better off?
h.With a quota in place what is the dollar value of producer surplus received by producers in Bragabong? Are domestic producers better off?
i.Calculate the revenue to foreign producers who are granted permission to sell in Bragabong after the imposition of the quota.
j.Calculate the deadweight loss as a result of the quota.
(Essay)
4.7/5 (39)
One of the main sources of comparative advantage is internal economies.
(True/False)
4.7/5 (32)
Figure 9-1 Figure 9-1 shows the U.S. demand and supply for leather footwear.
-Refer to Figure 9-1.Suppose the government allows imports of leather footwear into the United States.The market price falls to $18.What is the value of consumer surplus?
(Multiple Choice)
4.9/5 (34)
If Estonia has an absolute advantage in the production of two goods compared to Norway,Estonia can not benefit from trade with Norway.
(True/False)
4.8/5 (32)
In the 1970s and 1980s,the United States lost its comparative advantage in consumer electronics goods to Japan.What factor was most responsible for the development of Japan's comparative advantage in consumer electronics goods?
(Multiple Choice)
4.8/5 (39)
Once a country has lost its comparative advantage in producing a good,its income will be ________ and its economy will be ________ if it switches from producing the good to importing it.
(Multiple Choice)
4.9/5 (39)
Figure 9-1 Figure 9-1 shows the U.S. demand and supply for leather footwear.
-Refer to Figure 9-1.Suppose the government allows imports of leather footwear into the United States.What will be the domestic quantity supplied?
(Multiple Choice)
4.8/5 (36)
Japan has developed a comparative advantage in designing and producing automobiles.The source of its comparative advantage in these products is
(Multiple Choice)
4.8/5 (37)
Filters
- Essay(0)
- Multiple Choice(0)
- Short Answer(0)
- True False(0)
- Matching(0)