Exam 3: Tables and Graphs for Summarizing Data
Exam 1: Why Study Statistics9 Questions
Exam 2: An Introduction to Statistics53 Questions
Exam 3: Tables and Graphs for Summarizing Data26 Questions
Select questions type
The sum of all the relative frequencies of classes up to and including a particular class is defined as the:
(Multiple Choice)
4.8/5  (32)
(32)
A survey records the number of U.S.states each person has visited.This is an example of what type of data?
(Multiple Choice)
4.8/5 (28)
A student counted the number of candies of each color in a bag of 57 Reese's Pieces.The results are shown in the following bar graph. 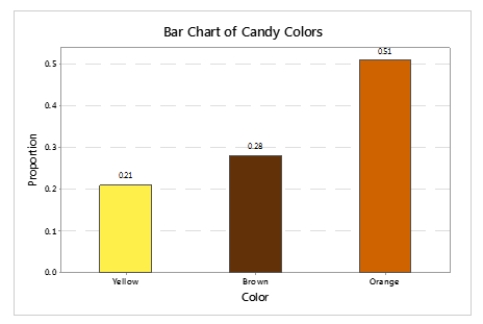 How many of the candies were colored orange?
(Multiple Choice)
4.9/5 (30)
A numeric data set is _____ if the set of all possible values is an interval of numbers.
(Multiple Choice)
4.9/5 (36)
Relative frequency is BEST suited to describe which data type?
(Multiple Choice)
4.8/5 (33)
Concerning univariate data,a _____ or _____ data set consists of observations that are numbers.
(Multiple Choice)
4.7/5 (31)
Filters
- Essay(0)
- Multiple Choice(0)
- Short Answer(0)
- True False(0)
- Matching(0)