Multiple Choice
A student counted the number of candies of each color in a bag of 57 Reese's Pieces.The results are shown in the following bar graph. 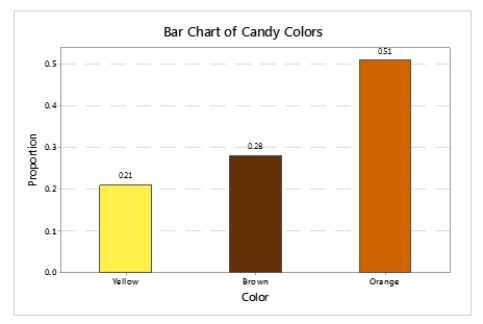 How many of the candies were colored orange?
A) 12
B) 51
C) 29
D) More information is needed to answer the question.
Correct Answer:

Verified
Correct Answer:
Verified
Related Questions
Q4: Two statistics students are arguing over which
Q18: A numerical data set is _ if
Q19: A cardiologist is studying the effects of
Q20: A student counted the number of candies
Q21: The sum of all the relative frequencies
Q22: A survey records the number of U.S.states
Q22: Concerning univariate data, a _ or _
Q24: A numeric data set is _ if
Q25: Relative frequency is BEST suited to describe
Q27: Concerning univariate data, a _ or _