Exam 21: Gdp and the Consumer Price Index
Exam 1: First Principles233 Questions
Exam 2: Economic Models- Trade-Offs and Trade313 Questions
Exam 3: Supply and Demand290 Questions
Exam 4: Consumer and Producer Surplus224 Questions
Exam 5: Price Controls and Quotas- Meddling With Markets201 Questions
Exam 6: Elasticity98 Questions
Exam 7: Taxes298 Questions
Exam 9: The Rational Consumer44 Questions
Exam 8: International Trade268 Questions
Exam 10: Decision Making by Individuals and Firms116 Questions
Exam 11: Perfect Competition and the Supply Curve355 Questions
Exam 12: Monopoly348 Questions
Exam 13: Oligopoly97 Questions
Exam 14: Monopolistic Competition and Product Differentiation124 Questions
Exam 15: Externalities140 Questions
Exam 16: Public Goods and Common Resources75 Questions
Exam 17: The Economics of the Welfare State91 Questions
Exam 18: Factor Markets and the Distribution of Income314 Questions
Exam 19: Uncertainty, Risk, and Private Information197 Questions
Exam 20: Macroeconomics- the Big Picture168 Questions
Exam 21: Gdp and the Consumer Price Index204 Questions
Exam 22: Unemployment and Inflation351 Questions
Exam 23: Long-Run Economic Growth313 Questions
Exam 24: Savings, Investment Spending398 Questions
Exam 25: Fiscal Policy376 Questions
Exam 26: Money, Banking, and the Federal Reserve System464 Questions
Exam 27: Monetary Policy359 Questions
Exam 28: Inflation, Disinflation, and Deflation240 Questions
Exam 29: Crises and Consequences214 Questions
Exam 30: Macroeconomics- Events and Ideas320 Questions
Exam 31: Open-Economy Macroeconomics466 Questions
Exam 32: Graphs in Economics64 Questions
Exam 33: Toward a Fuller Understanding36 Questions
Exam 34: Consumer Preferences and Consumer Choice62 Questions
Exam 35: Indifference Curve Analysis of Labor Supply41 Questions
Select questions type
If nominal GDP of 2012 was higher than nominal GDP of 2011:
(Multiple Choice)
4.7/5  (33)
(33)
Use the following to answer questions
Figure: Expanded Circular-Flow Model 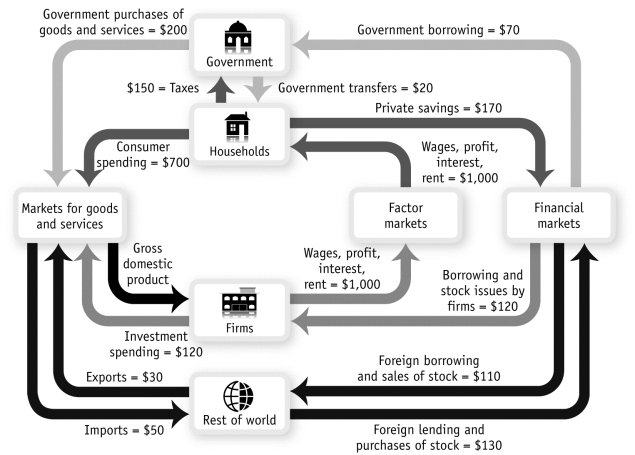 -(Figure: Expanded Circular-Flow Model) Look at the figure Expanded Circular-Flow Model. The total flow of funds into and out of households is:
(Multiple Choice)
4.9/5 (34)
Which of the following would accurately characterize the portion of a firm's profit paid to the owner of one share of its stock?
(Multiple Choice)
4.9/5 (38)
In the circular-flow diagram, the places where goods and services are bought and sold are the:
(Multiple Choice)
4.9/5 (38)
Use the following to answer questions
Figure: Circular-Flow Model 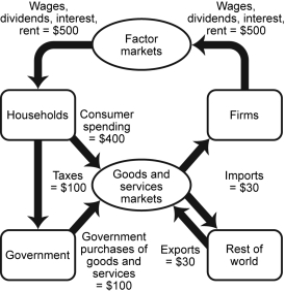 -(Figure: Circular-Flow Model) Look at the figure Circular-Flow Model. How does the government finance its purchases of goods and services?
(Multiple Choice)
4.9/5 (38)
Assume that the real GDP of the United States is approximately $12 trillion and the population of the United States is approximately 300 million. What is per capita real GDP?
(Multiple Choice)
4.9/5 (34)
Consider an economy that produces only DVDs and DVD players. Last year, 10 DVDs were sold at $20 each and 5 DVD players were sold at $100 each, while this year 15 DVDs were sold at $10 each and 10 DVD players were sold at $50 each. Real GDP this year using last year as the base year is:
(Multiple Choice)
4.7/5 (31)
In the United States, government spending accounts for approximately_____ of GDP.
(Multiple Choice)
4.9/5 (36)
If both aggregate output and the aggregate price level increase:
(Multiple Choice)
4.9/5 (29)
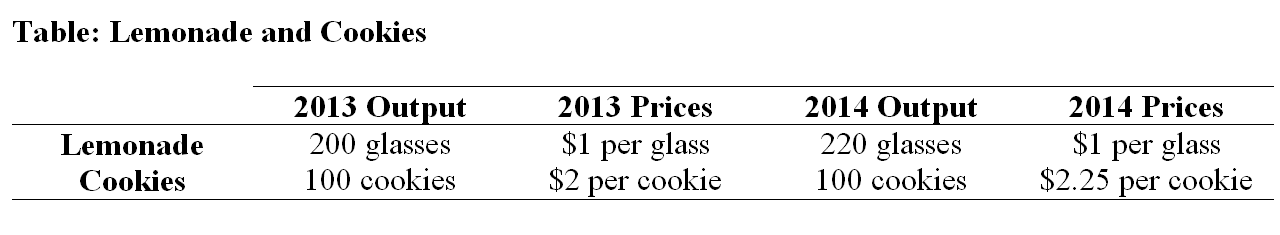 -(Table: Lemonade and Cookies) Look at the table Lemonade and Cookies. Assume that an economy produces only lemonade and cookies. Assuming 2013 was the base year, the growth rate of real GDP from 2013 to 2014 was:
(Multiple Choice)
5.0/5 (37)
Use the following to answer questions
Scenario: Real GDP
Suppose that in year 1 an economy produces 100 golf balls that sell for $3 each and 75 pizzas that sell for $8 each. The next year the economy produces 110 golf balls that sell for $3.25 each and 80 pizzas that sell for $9 each.
-(Scenario: Real GDP) Look at the scenario Real GDP. Using year 1 as the base year, real GDP in year 2 is:
(Multiple Choice)
4.8/5 (39)
-(Table: Lemonade and Cookies) Look at the table Lemonade and Cookies. Assume that an economy produces only lemonade and cookies. If 2013 is the base year, real GDP in 2013 was:
(Multiple Choice)
4.9/5 (41)
Filters
- Essay(0)
- Multiple Choice(0)
- Short Answer(0)
- True False(0)
- Matching(0)