Exam 35: Indifference Curve Analysis of Labor Supply
Exam 1: First Principles233 Questions
Exam 2: Economic Models- Trade-Offs and Trade313 Questions
Exam 3: Supply and Demand290 Questions
Exam 4: Consumer and Producer Surplus224 Questions
Exam 5: Price Controls and Quotas- Meddling With Markets201 Questions
Exam 6: Elasticity98 Questions
Exam 7: Taxes298 Questions
Exam 9: The Rational Consumer44 Questions
Exam 8: International Trade268 Questions
Exam 10: Decision Making by Individuals and Firms116 Questions
Exam 11: Perfect Competition and the Supply Curve355 Questions
Exam 12: Monopoly348 Questions
Exam 13: Oligopoly97 Questions
Exam 14: Monopolistic Competition and Product Differentiation124 Questions
Exam 15: Externalities140 Questions
Exam 16: Public Goods and Common Resources75 Questions
Exam 17: The Economics of the Welfare State91 Questions
Exam 18: Factor Markets and the Distribution of Income314 Questions
Exam 19: Uncertainty, Risk, and Private Information197 Questions
Exam 20: Macroeconomics- the Big Picture168 Questions
Exam 21: Gdp and the Consumer Price Index204 Questions
Exam 22: Unemployment and Inflation351 Questions
Exam 23: Long-Run Economic Growth313 Questions
Exam 24: Savings, Investment Spending398 Questions
Exam 25: Fiscal Policy376 Questions
Exam 26: Money, Banking, and the Federal Reserve System464 Questions
Exam 27: Monetary Policy359 Questions
Exam 28: Inflation, Disinflation, and Deflation240 Questions
Exam 29: Crises and Consequences214 Questions
Exam 30: Macroeconomics- Events and Ideas320 Questions
Exam 31: Open-Economy Macroeconomics466 Questions
Exam 32: Graphs in Economics64 Questions
Exam 33: Toward a Fuller Understanding36 Questions
Exam 34: Consumer Preferences and Consumer Choice62 Questions
Exam 35: Indifference Curve Analysis of Labor Supply41 Questions
Select questions type
Use the following to answer questions
Figure: Davina's Labor Supply Choice 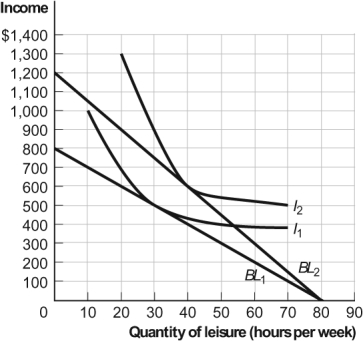 -(Figure: Davina's Labor Supply Choice) The figure Davina's Labor Supply Choice shows Davina's time allocation budget line when her hourly wage is $10 or $15 and she has 80 hours to allocate between labor and leisure; it also shows two of her indifference curves for income and leisure. When Davina earns $10 per hour, she works _____ hours and enjoys _____ hours of leisure.
(Multiple Choice)
4.9/5  (30)
(30)
Miss Marple spends her entire leisure time gardening. She values the marginal utility of the last hour spent gardening at $17. She could earn $20 if she worked an additional hour. Assuming that Miss Marple wants to maximize her utility, which of the following is CORRECT?
(Multiple Choice)
4.9/5 (26)
Use the following to answer questions
Figure: Rita's Time Allocation Budget Line 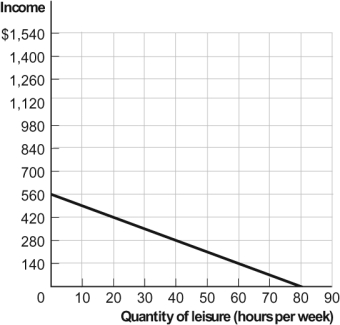 -(Figure: Rita's Time Allocation Budget Line) Look at the figure Rita's Time Allocation Budget Line. It is based on 80 hours available for labor and leisure. If her hourly wage doubles, the vertical intercept will be:
(Multiple Choice)
4.8/5 (32)
Dorothy is trying to decide how to allocate her time between work and leisure. Suppose that she can work a maximum of 75 hours per week. If she can earn $15 per hour, the vertical intercept of her time allocation budget line (with income plotted vertically and leisure plotted horizontally) is:
(Multiple Choice)
4.8/5 (40)
To maximize utility, an individual should allocate time so that the marginal utility of the earnings from an hour spent working is equal to the marginal utility of an additional hour of leisure.
(True/False)
4.8/5 (29)
While individual labor supply curves may bend backward, market labor supply curves are likely to be upward-sloping throughout, since higher wages induce new workers to enter the labor market.
(True/False)
5.0/5 (32)
Alex's wage rate falls. Holding everything else constant, Alex's new time allocation budget line will:
(Multiple Choice)
4.8/5 (35)
Use the following to answer questions
Figure: Income and Leisure Opportunities 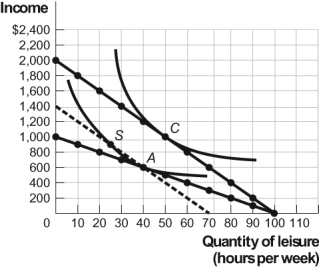 -(Figure: Income and Leisure Opportunities) The figure Income and Leisure Opportunities refers to Keisha when she has 100 hours per week for working or leisure. There are two time allocation lines, one for a $10 hourly wage rate and one for a $20 hourly wage rate. Keisha's optimal choice is point A when the wage is $10, and her optimal choice is point C when the wage is $20. As the amount she earns increases from $10 per hour to $20 per hour, Keisha will work _____ hours because of the income effect.
(Multiple Choice)
4.8/5 (40)
Consider the time allocation budget line for Priya. Put hours of leisure on the horizontal axis and income on the vertical axis. If Priya can allocate 100 hours per week to either leisure or work and her wage per hour is $18, then the vertical intercept is _____ and the slope of the time allocation budget line is _____.
(Multiple Choice)
4.8/5 (36)
Use the following to answer questions
Figure: The Time Allocation Budget Line 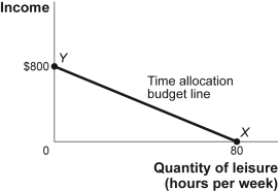 -(Figure: The Time Allocation Budget Line) Look at the figure The Time Allocation Budget Line. If the wage rate rises, then the time allocation budget line will rotate _____ along the _____ axis.
(Multiple Choice)
4.9/5 (39)
Use the following to answer questions
Figure: Davina's Labor Supply Choice
-(Figure: Davina's Labor Supply Choice) The figure Davina's Labor Supply Choice shows Davina's time allocation budget line when her hourly wage is $10 or $15 and she has 80 hours to allocate between labor and leisure; it also shows two of her indifference curves for income and leisure. When Davina earns $15 per hour, she works _____ hours and enjoys _____ hours of leisure.
(Multiple Choice)
4.9/5 (41)
Use the following to answer questions
Figure: Rita's Time Allocation Budget Line
-(Figure: Rita's Time Allocation Budget Line) Look at the figure Rita's Time Allocation Budget Line. It is based on 80 hours available for labor and leisure. Her hourly wage is:
(Multiple Choice)
4.8/5 (36)
If an individual's labor supply curve is upward-sloping at low wage rates and downward-sloping at high wage rates, then at higher wage rates:
(Multiple Choice)
4.8/5 (39)
If leisure is a normal good for Randy, then both the substitution effect and the income effect of a decrease in the wage rate will cause Randy to work fewer hours.
(True/False)
4.8/5 (40)
Use the following to answer questions
Figure: Income and Leisure Opportunities
-(Figure: Income and Leisure Opportunities) The figure Income and Leisure Opportunities refers to Keisha when she has 100 hours per week for working or leisure. There are two time allocation lines, one for a $10 hourly wage rate and one for a $20 hourly wage rate. Keisha's optimal choice is point A when the wage is $10, and her optimal choice is point C when the wage is $20. As the amount she earns increases from $10 to $20 per hour, Keisha will work _____ hours because of the substitution effect.
(Multiple Choice)
4.8/5 (35)
During the holiday season some people take a second job or work more hours. From this we know that:
(Multiple Choice)
4.8/5 (34)
Use the following to answer questions
Figure: Income and Leisure Opportunities
-(Figure: Income and Leisure Opportunities) Given Keisha's preferences and opportunities for income and leisure shown in the figure Income and Leisure Opportunities, Keisha sees leisure as:
(Multiple Choice)
4.8/5 (39)
Use the following to answer questions
Figure: Joanna's Time Allocation Budget Line 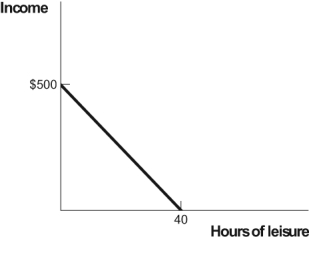 -(Figure: Joanna's Time Allocation Budget Line) The figure Joanna's Time Allocation Budget Line depicts what happens when she can choose how to spend 40 hours. If Joanna's wage increases and as a result she consumes LESS leisure, her supply curve of labor is:
(Multiple Choice)
4.9/5 (44)
Use the following to answer questions
Figure: Rita's Time Allocation Budget Line
-(Figure: Rita's Time Allocation Budget Line) Look at the figure Rita's Time Allocation Budget Line. It is based on 80 hours available for labor and leisure. Rita chooses 40 hours of leisure and income of $280. When her hourly wage doubles, Rita chooses 30 hours of leisure and income of $700. The substitution effect is making her work _____, the income effect is making her work _____, and the substitution effect is _____ than the income effect.
(Multiple Choice)
4.8/5 (26)
Use the following to answer questions
Figure: Joanna's Time Allocation Budget Line
-(Figure: Joanna's Time Allocation Budget Line) Joanna's Time Allocation Budget Line depicts what happens when she can choose how to spend 40 hours. If Joanna's wage rate increases and she ends up working more hours, for her:
(Multiple Choice)
4.9/5 (36)
Filters
- Essay(0)
- Multiple Choice(0)
- Short Answer(0)
- True False(0)
- Matching(0)