Exam 34: Consumer Preferences and Consumer Choice
Exam 1: First Principles233 Questions
Exam 2: Economic Models- Trade-Offs and Trade313 Questions
Exam 3: Supply and Demand290 Questions
Exam 4: Consumer and Producer Surplus224 Questions
Exam 5: Price Controls and Quotas- Meddling With Markets201 Questions
Exam 6: Elasticity98 Questions
Exam 7: Taxes298 Questions
Exam 9: The Rational Consumer44 Questions
Exam 8: International Trade268 Questions
Exam 10: Decision Making by Individuals and Firms116 Questions
Exam 11: Perfect Competition and the Supply Curve355 Questions
Exam 12: Monopoly348 Questions
Exam 13: Oligopoly97 Questions
Exam 14: Monopolistic Competition and Product Differentiation124 Questions
Exam 15: Externalities140 Questions
Exam 16: Public Goods and Common Resources75 Questions
Exam 17: The Economics of the Welfare State91 Questions
Exam 18: Factor Markets and the Distribution of Income314 Questions
Exam 19: Uncertainty, Risk, and Private Information197 Questions
Exam 20: Macroeconomics- the Big Picture168 Questions
Exam 21: Gdp and the Consumer Price Index204 Questions
Exam 22: Unemployment and Inflation351 Questions
Exam 23: Long-Run Economic Growth313 Questions
Exam 24: Savings, Investment Spending398 Questions
Exam 25: Fiscal Policy376 Questions
Exam 26: Money, Banking, and the Federal Reserve System464 Questions
Exam 27: Monetary Policy359 Questions
Exam 28: Inflation, Disinflation, and Deflation240 Questions
Exam 29: Crises and Consequences214 Questions
Exam 30: Macroeconomics- Events and Ideas320 Questions
Exam 31: Open-Economy Macroeconomics466 Questions
Exam 32: Graphs in Economics64 Questions
Exam 33: Toward a Fuller Understanding36 Questions
Exam 34: Consumer Preferences and Consumer Choice62 Questions
Exam 35: Indifference Curve Analysis of Labor Supply41 Questions
Select questions type
Use the following to answer questions
Figure: The Indifference Curve Map II 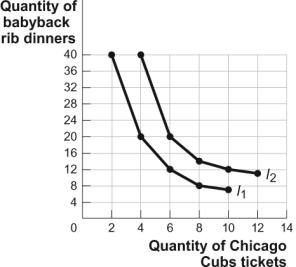 -(Figure: The Indifference Curve Map II) Look at the figure The Indifference Curve Map II. Sara enjoys attending Chicago Cubs baseball games and eating baby back rib dinners. The figure shows two of her indifference curves for Cubs tickets and baby back rib dinners. If a new health report is released stating that there is a connection between baby back rib dinners and heart attacks and this concerns Sara, each combination of Cubs tickets and baby back ribs will now yield _____ for Sara.
(Multiple Choice)
4.9/5  (39)
(39)
One point on an indifference curve that displays a diminishing marginal rate of substitution between apples and oranges is 10 apples and 2 oranges; another is 8 apples and 4 oranges. Which of the following combinations of apples and oranges could also lie on this indifference curve?
(Multiple Choice)
4.7/5 (40)
Use the following to answer question
Figure and Table: An Indifference Curve Map 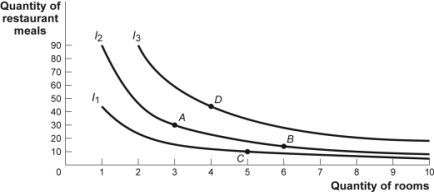
 -(Figure and Table: Indifference Curve Map) Look at the figure and table An Indifference Curve Map. Combination _____ is preferred to combination _____.
(Multiple Choice)
4.9/5 (38)
Higher total utility is represented by _____ indifference curve.
(Multiple Choice)
4.8/5 (38)
Use the following to answer questions
Figure: Consumer Equilibrium I
The figure shows three of Owen's indifference curves for pizza and soda per week. Owen has $180 per month to spend on the two goods. The price of a pizza is $20, and the price of a soda is $1.50. 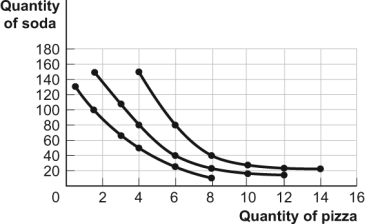 -(Figure: Consumer Equilibrium I) Look at the figure Consumer Equilibrium I. If in equilibrium Owen receives marginal utility of 10 utils from the last pizza he consumes, his marginal utility from the last soda must be _____ utils.
(Multiple Choice)
4.7/5 (30)
An indifference curve is a line showing all of the consumption bundles that:
(Multiple Choice)
4.7/5 (31)
Luis is consuming his optimal consumption bundle of pizza and tacos. The marginal utility associated with the last pizza he consumes is 1 util, and the marginal utility associated with the last taco is 3 utils. What must be the relative price of pizza in terms of tacos?
(Multiple Choice)
4.8/5 (31)
If combination A lies on a higher indifference curve than combination B and combination B lies on a higher indifference curve than combination C, it must be that the total utility associated with combination A is _____ the total utility associated with combination C.
(Multiple Choice)
4.9/5 (37)
After learning about indifference curves, Sandy realizes that her marginal rate of substitution of grapes for cheese is 2. Since the price of cheese is $3 and the price of grapes is $1, Sandy:
(Multiple Choice)
4.9/5 (41)
Use the following to answer questions
Figure: Consumer Equilibrium I
The figure shows three of Owen's indifference curves for pizza and soda per week. Owen has $180 per month to spend on the two goods. The price of a pizza is $20, and the price of a soda is $1.50.
-(Figure: Consumer Equilibrium I) Look at the figure Consumer Equilibrium I. If Owen consumes 1.5 pizzas and 100 sodas, which of the following describes the relationship between his marginal rate of substitution of pizza for soda and the price of pizza in terms of soda?
(Multiple Choice)
4.9/5 (30)
Assume that two combinations of two goods yield the same level of satisfaction. We can conclude that these combinations are always on:
(Multiple Choice)
4.8/5 (43)
Joseph chooses a combination of apples and oranges along his budget line. The marginal rate of substitution of apples for oranges is 2, the price of an apple is $0.50, and the price of an orange is $0.25. Joseph:
(Multiple Choice)
4.7/5 (39)
LaToya sees honey and sugar as perfect substitutes. She is always willing to substitute 1 teaspoon of honey for 2 teaspoons of sugar. If the price of honey is half that of sugar, LaToya will use:
(Multiple Choice)
4.7/5 (44)
A curve that represents combinations of two goods that yield equal levels of satisfaction is a(n):
(Multiple Choice)
4.9/5 (34)
Joseph chooses a combination of apples and oranges along his budget line. The marginal rate of substitution of apples for oranges is 2, the price of an apple is $0.50, and the price of an orange is $0.50. Joseph:
(Multiple Choice)
4.8/5 (32)
The relative price rule says that at the optimal consumption bundle the marginal rate of substitution between two goods must be equal to their relative price. This is equivalent to saying that:
(Multiple Choice)
4.7/5 (38)
An indifference curve shows combinations of two goods that yield:
(Multiple Choice)
4.9/5 (31)
If two combinations of two goods yield the same level of satisfaction, then they are on:
(Multiple Choice)
4.9/5 (35)
Filters
- Essay(0)
- Multiple Choice(0)
- Short Answer(0)
- True False(0)
- Matching(0)